Simulation · A game by CUBE4DEV · UNTERNEHMERAVANTGARDE
Minimal Energy
Where Germany's power comes from – 50 years of the energy system in blocks.
-
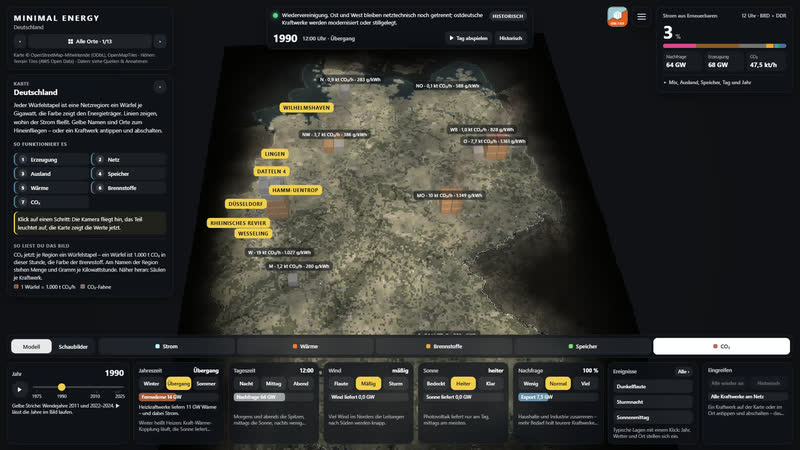
CO₂ view, 1990: every cube is 1,000 t of CO₂ this hour – amount and grams per kilowatt hour at each region.
-
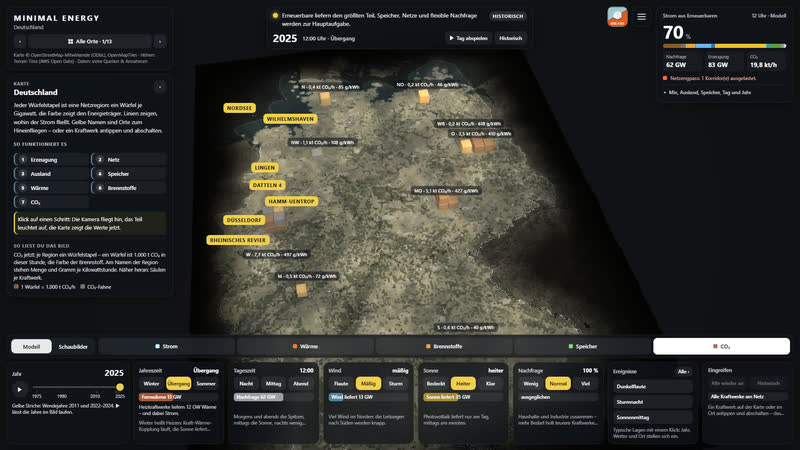
The same hour in 2025: wind and sun shrink the stacks.
-
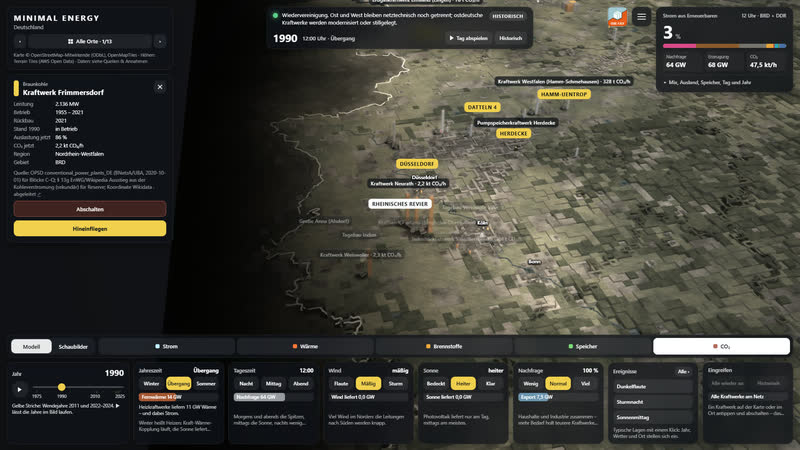
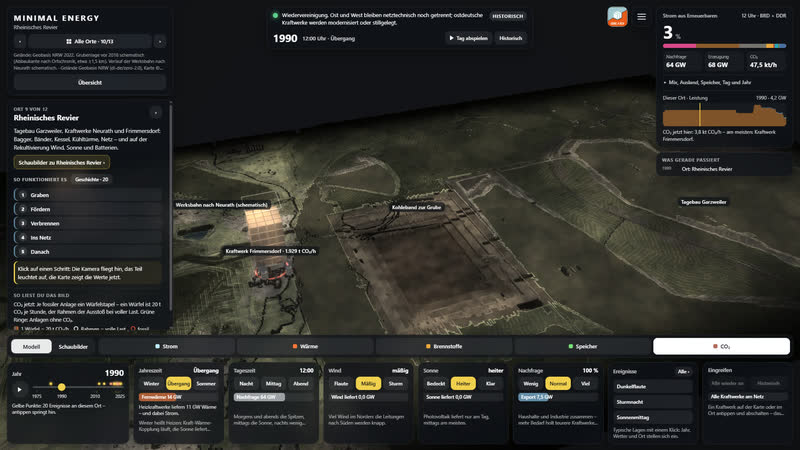
Closer in: columns and values per power plant in the Rhineland; on the left the card of Frimmersdorf with CO₂ now.
-
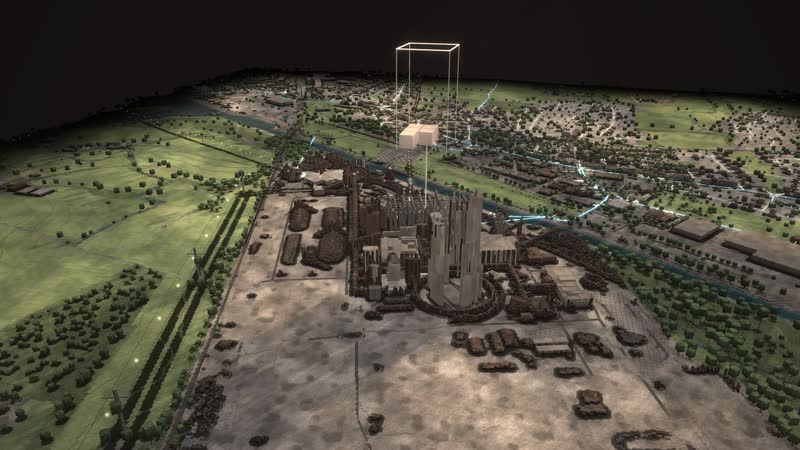
Rhenish lignite area 1990: the stack above Frimmersdorf shows the emissions now, the frame those at full load.
-
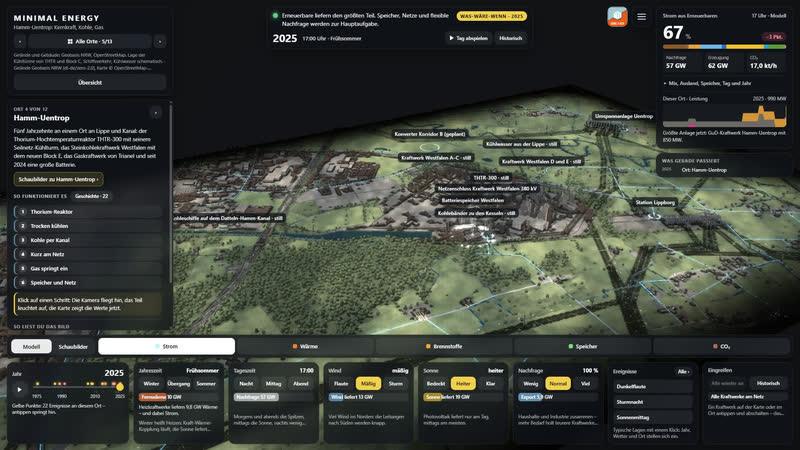
Hamm-Uentrop: the land fades into darkness at the edges; on the left the info card with the way to the place’s diagrams.
-
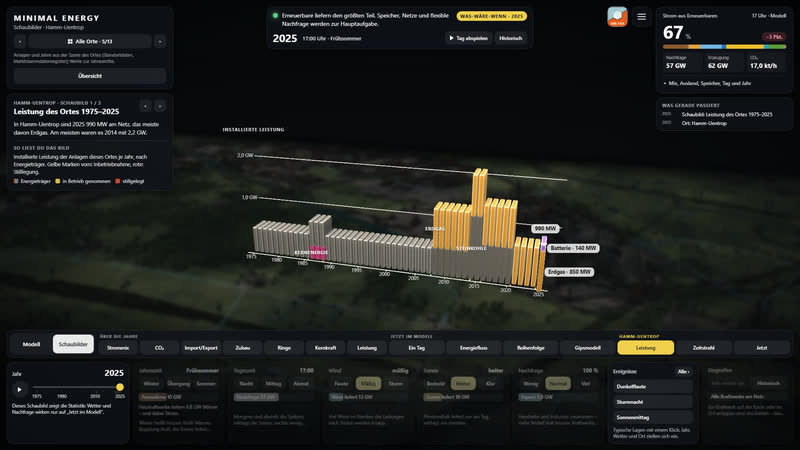
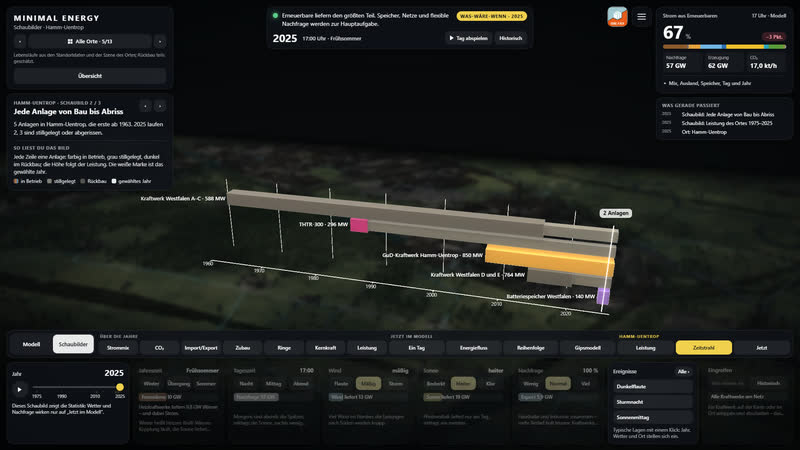
Diagram per place: capacity at Hamm-Uentrop from 1975 to 2025 – coal, nuclear, gas and battery.
-
Every plant from construction to demolition: in operation coloured, shut down grey.
-
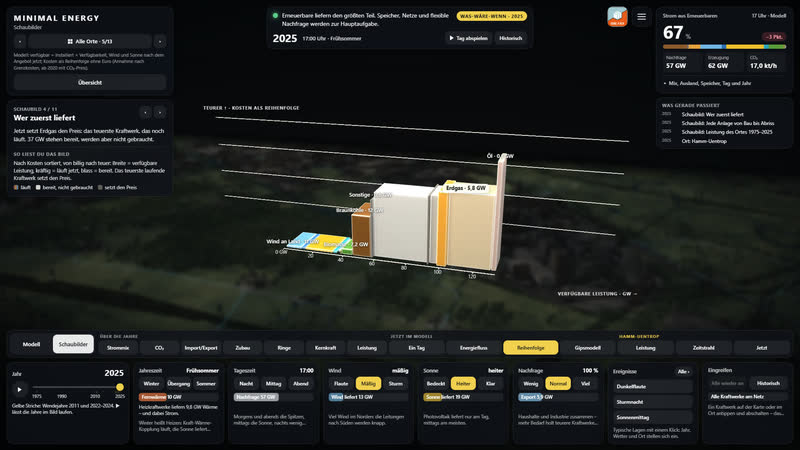
Diagram ‘merit order’ in front of the blurred landscape seen from the same angle.
-
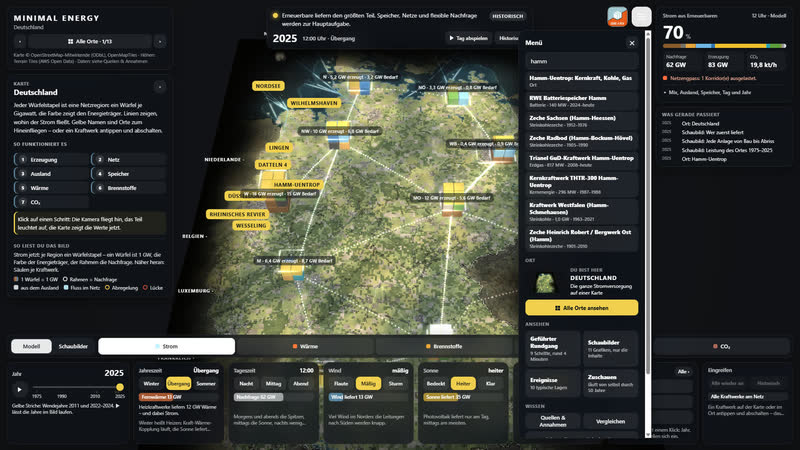
Search in the menu: places and power plants with capacity and years of operation.
-
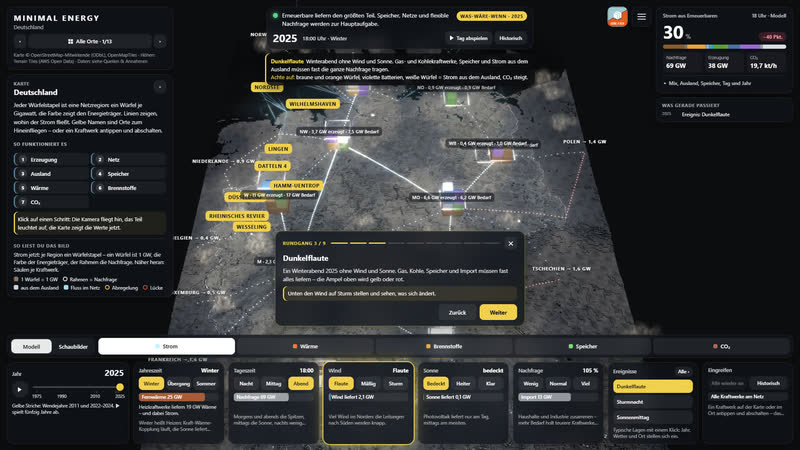
Tour, step 3: dark doldrums on a winter evening. Below, the wind tile lights up so you can intervene yourself.
-
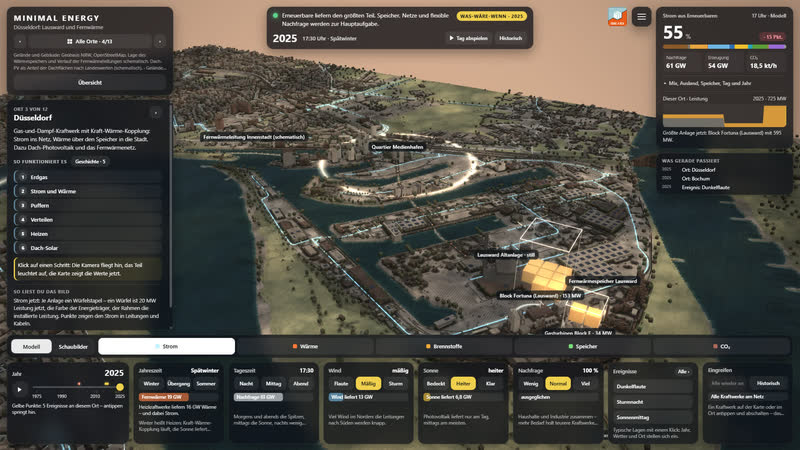
Düsseldorf in the evening: Lausward power station with its current output, heat storage and the grid through the city.
-
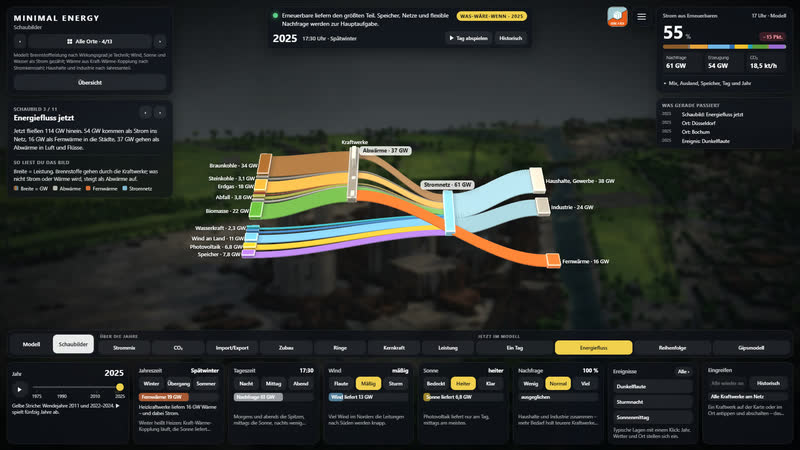
Energy flow diagram: where energy comes from and where it goes – in front of a dark, blurred landscape.
Background
Sites, operating periods and capacities are researched from AG Energiebilanzen, the German Environment Agency, the Federal Network Agency, BASE and the operators. Grid and terrain come from OpenStreetMap and open elevation data. Every site names its source and whether the value is documented, derived or estimated.
The scenario model is deliberately simple. Ten grid regions, dispatch by cost order, base load and combined heat and power, storage with a state of charge. Power, heat and fuels stay separate. Whatever cannot be covered remains as a gap.
Eight places make it concrete: the Rhineland lignite district, Düsseldorf with district heating, Herdecke with three generations of storage, Datteln 4 with coal ships, Lingen with nuclear power up to dismantling, the Paderborn plateau and the North Sea off Borkum with every single wind turbine from the market master data register – and Wesseling, where the refinery is turning to hydrogen.
Plus three places where energy arrives or is transformed: Wilhelmshaven with crude oil, coal and Germany's first LNG terminal, the coast near Norden where offshore power and Norwegian gas come ashore, and Bochum, where water from a colliery heats a new district.
The wind turbines come from the Federal Network Agency's market master data register (dl-de/by-2-0). It only goes back to 2019; turbines dismantled earlier are missing, so early years show too few, and the game notes this. In Wesseling some positions are schematic and marked as such.
Thirteen places
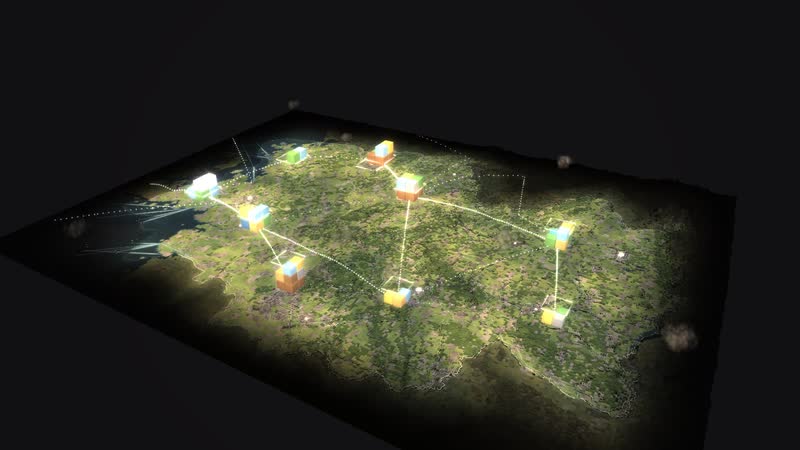
The map of Germany from 1975 to 2025 with 365 sites, and twelve walkable places, reached from the places bar.
Coal and nuclear
-
Rhineland lignite district
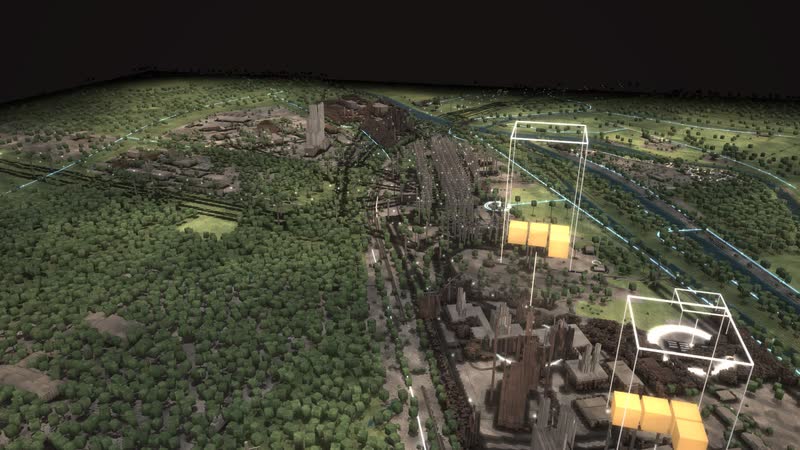
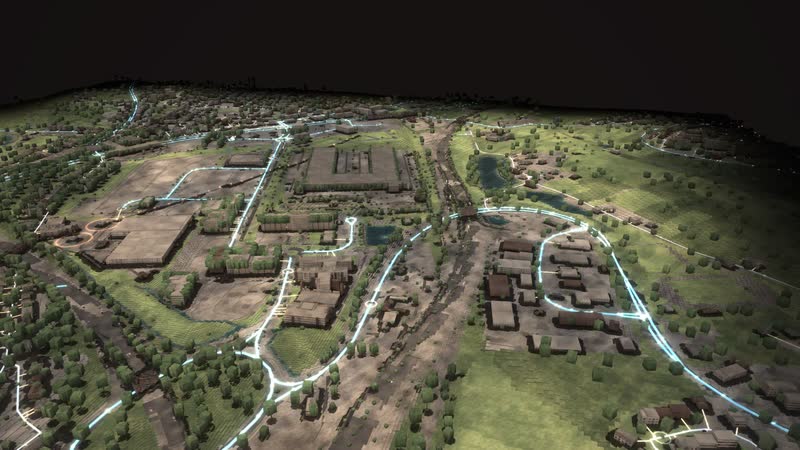
The Rhineland lignite district as a walkable model: from the Garzweiler mine via conveyors, boilers and cooling towers into the 380 kV grid – while wind, sun and batteries grow on the reclaimed land.
-
Datteln 4
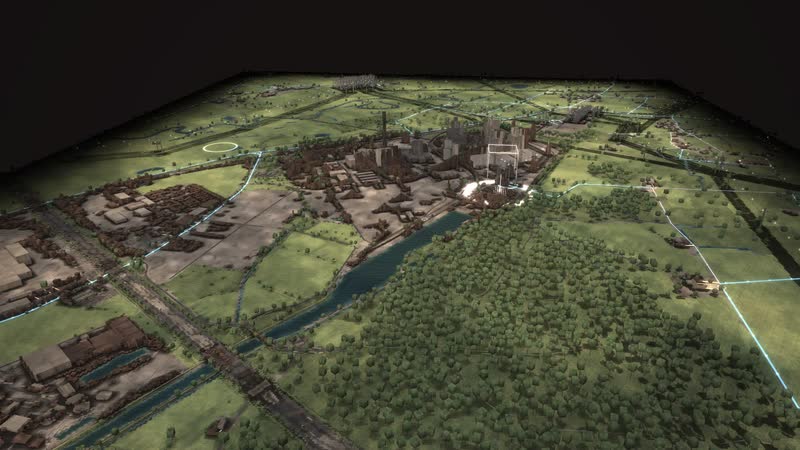
Germany’s newest hard-coal plant as a walkable model: coal by ship on the Dortmund-Ems Canal, power for the grid and the railway, district heat as far as Recklinghausen.
-
Lingen
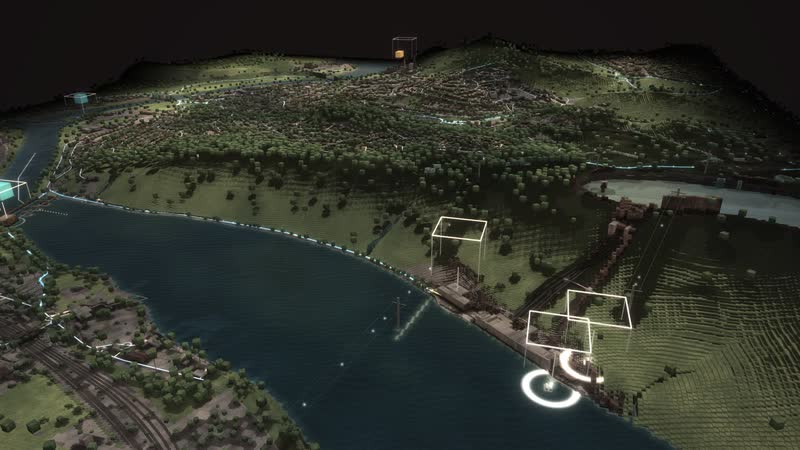
The whole nuclear era in one place as a walkable model: the Lingen nuclear plant of 1968, the Emsland nuclear plant until April 2023, interim storage and dismantling – next to them gas, a battery and hydrogen.
-
Hamm-Uentrop
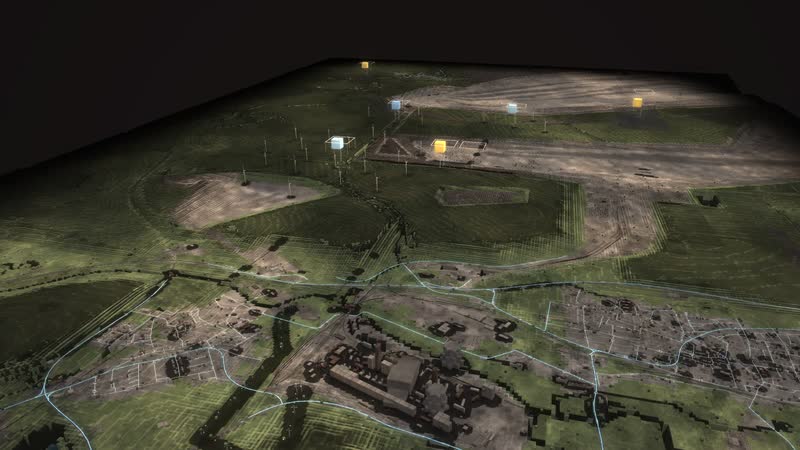
Five decades of energy on the Lippe and the canal as a walkable model: the THTR-300 thorium reactor, the Westfalen hard-coal plant, a gas plant, a large battery – and soon direct current from Wilhelmshaven.
Heat and storage
-
Düsseldorf Lausward
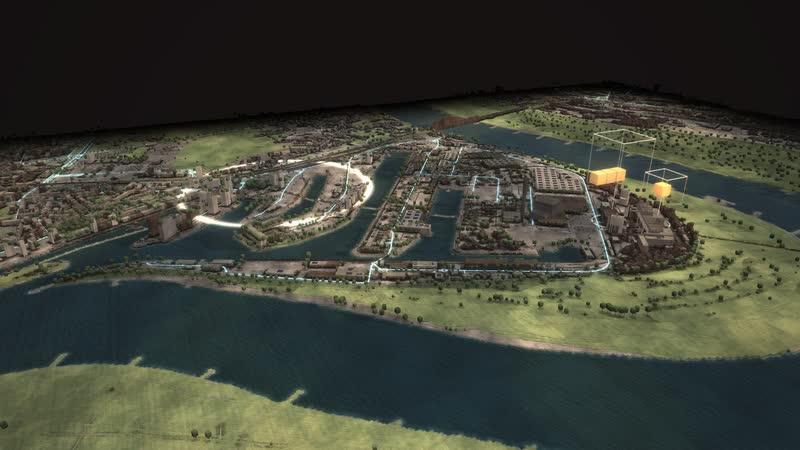
A combined-cycle gas plant on the Rhine as a walkable model: power to the grid, heat via a 58 m storage tank and the district heating line into the media harbour and the city centre.
-
Herdecke
Three generations of storage at Lake Hengstey as a walkable model: the Koepchenwerk of 1930, the pumped-storage plant of 1989 and batteries since 2017 – the level in the reservoir follows sun, wind and demand.
-
Bochum · MARK 51°7
A former car plant above the Dannenbaum colliery as a walkable model: the new MARK 51°7 district is to draw heating and cooling from the water of the old mine, from 820 and 340 m down.
Wind and sea
-
Paderborn plateau
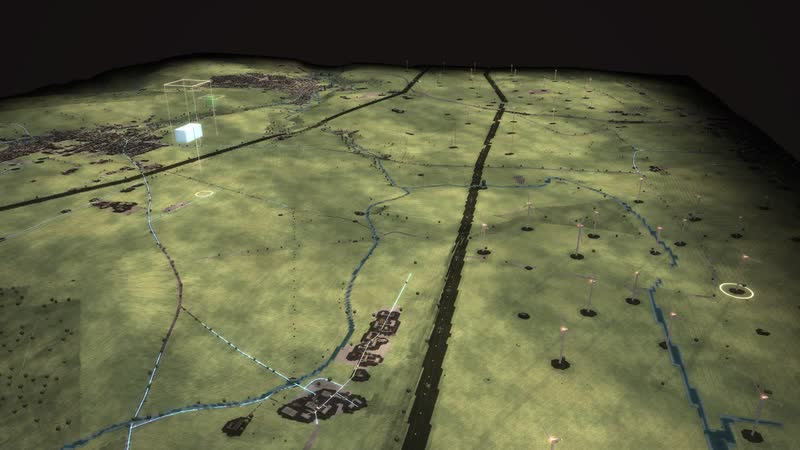
One of the densest wind landscapes in North Rhine-Westphalia as a walkable model: every turbine with its year, from the 500 kW turbine of 1995 to the 6.2 MW turbine with a 169 m hub.
-
North Sea off Borkum
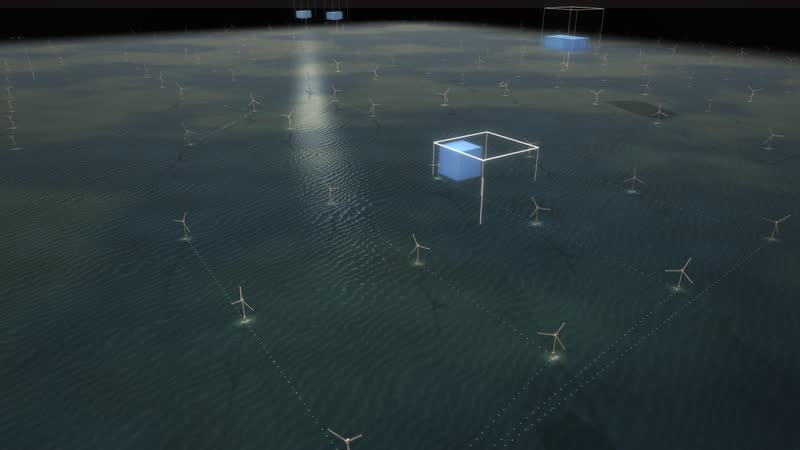
The beginning of German offshore wind as a walkable model: twelve test turbines from 2009, a cluster of 284 turbines and about 1,660 MW, substation and converter platforms and the way ashore.
-
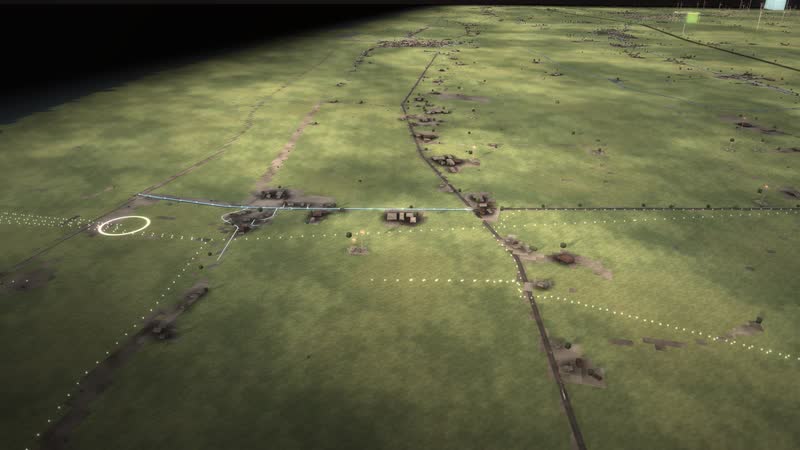
Coast near Norden
Where energy from the North Sea comes ashore, as a walkable model: six direct-current cables under the dike, natural gas from Norway since 1995 and more than 200 wind turbines behind the dike.
Gas, oil and hydrogen
-
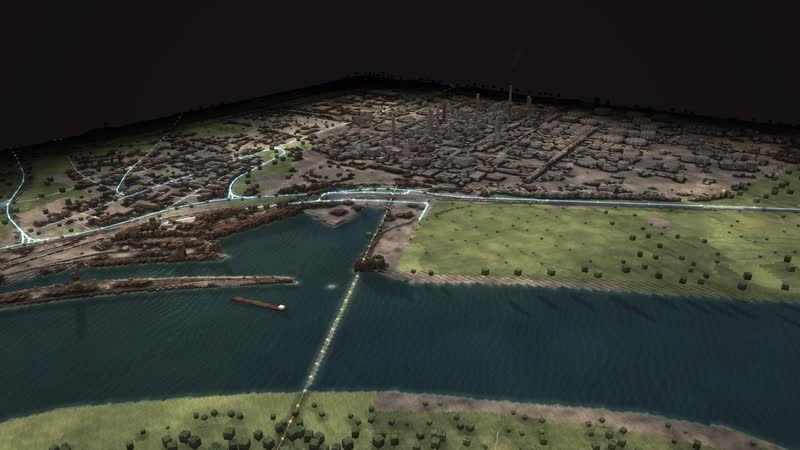
Wesseling
Germany’s largest refinery site as a walkable model: crude oil from Rotterdam and Wilhelmshaven, distillation column, tank farm and Rhine ships – and since 2021 hydrogen made from power.
-
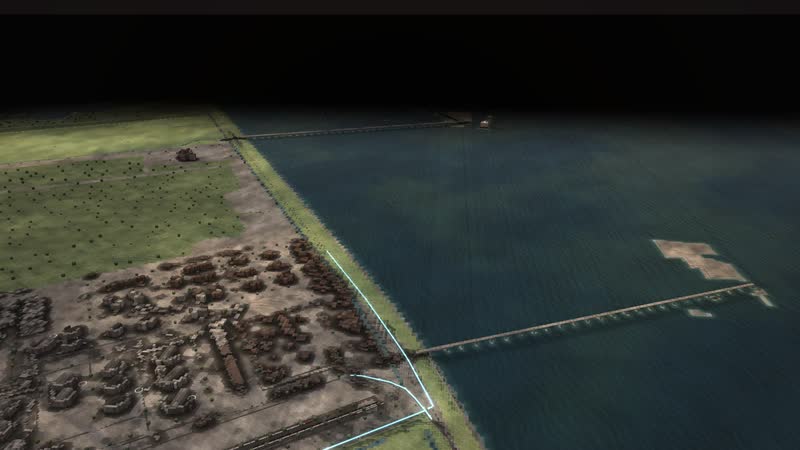
Wilhelmshaven
Germany’s only deep-water port as a walkable model: crude oil for the pipeline to the Rhineland, coal for two power plants and, since December 2022, liquefied natural gas from Germany’s first LNG terminal.
Minimal Energy…
More +−
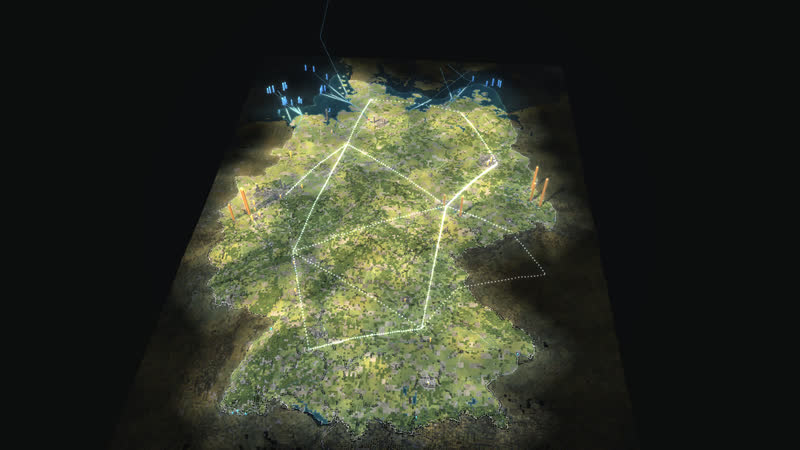
MINIMAL ENERGY shows where Germany's energy comes from, how it is distributed and how the system has changed since 1975. On a block map of Germany, power plants, mines, wind farms and solar fields appear, run, shut down and are dismantled. Power visibly flows through the grid corridors and across borders.
A year slider runs from 1975 to 2025. Before 1990, West Germany, East Germany and West Berlin are separate systems. Afterwards the grids grow together, nuclear power goes, wind and solar arrive.
Six controls change demand, time of day, sun, wind and season. Every change immediately becomes a marked what-if: storage charges and discharges, imports shift, bottlenecks and supply gaps become visible.
Every control has a visible effect: time of day and season move the sun and bring snow, foliage and chimney smoke; at night windows and plants light up. The views show power, heat, fuels, storage and CO₂ right at the plants, with values that update immediately.
In every place, steps lead through the chain – from delivery to the grid or to heat. A click shows the plant with its values now, the legend explains every colour.
Intervene yourself: every power plant can be switched off, and the simulation shows at once who steps in. Ten events – from dark doldrums to the end of nuclear power – lead into typical situations with one click.
A guided tour leads through fifty years of energy in nine steps – and in the places you can watch power flow into every house while cars and trains move through the streets.
How to play
More +−
- The year slider runs from 1975 to 2025.
- Six controls: household and industrial demand, time of day, sun, wind, season.
- Views: power, heat, fuels, storage, CO₂.
- Comparison: two years, or a scenario against the starting point. The demo shows everything by itself.
Minimal Energy
Where Germany's power comes from – 50 years of the energy system in blocks.
cube4tec.de/spiele/minimal-energy/