
Simulation · Minimal City · Germany
Hamburg · town hall, Speicherstadt and Elbphilharmonie
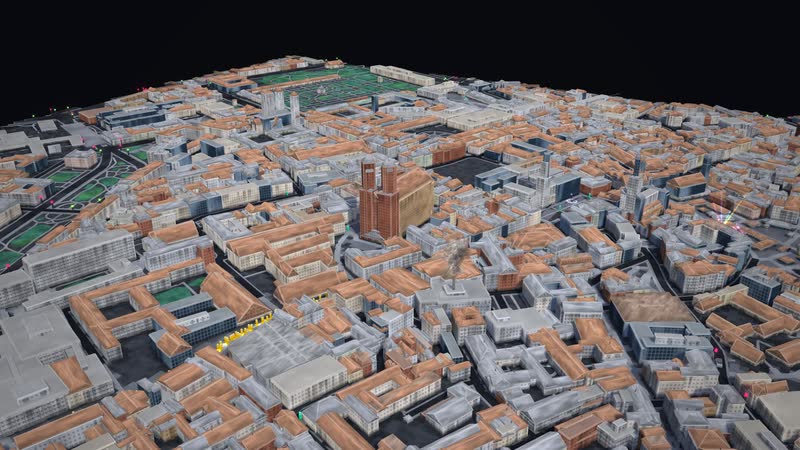
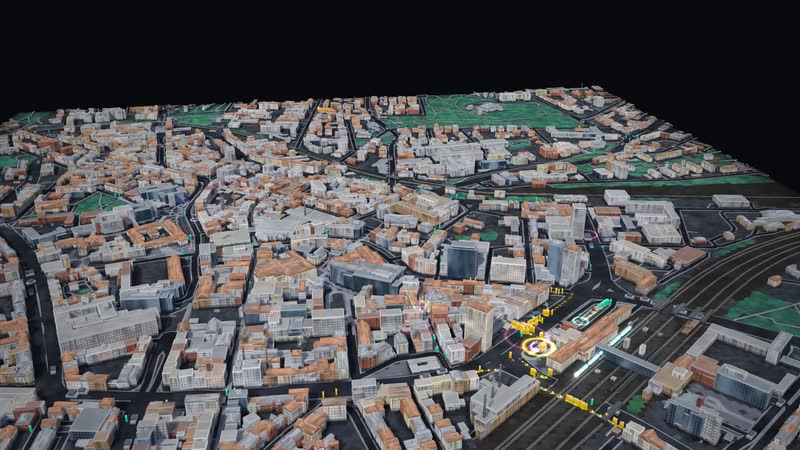
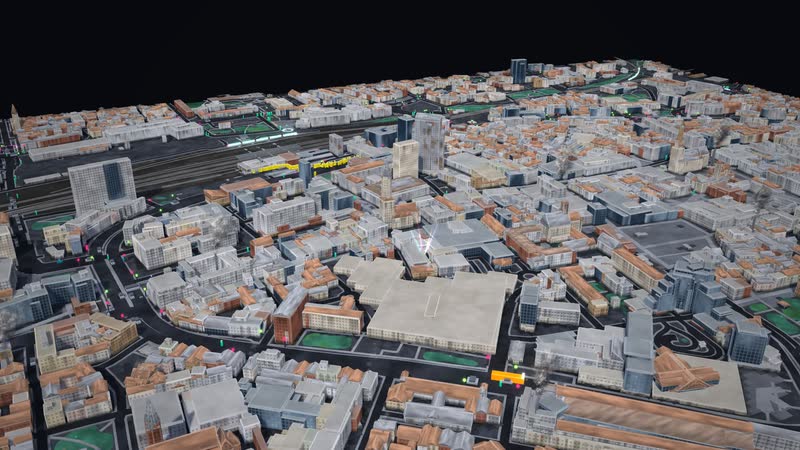
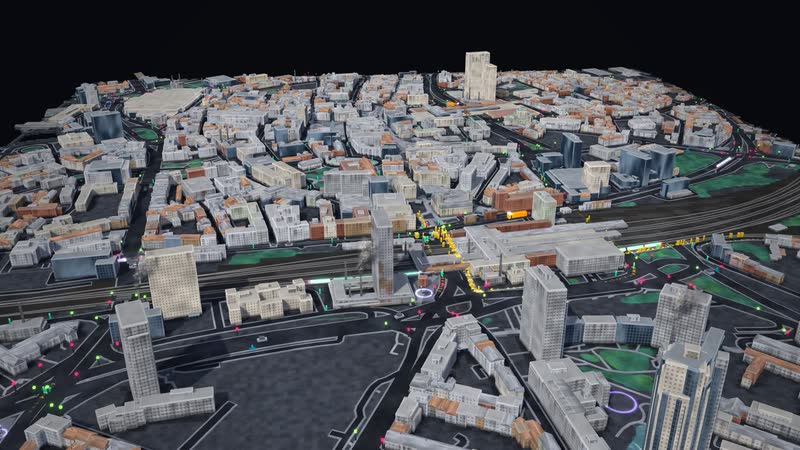
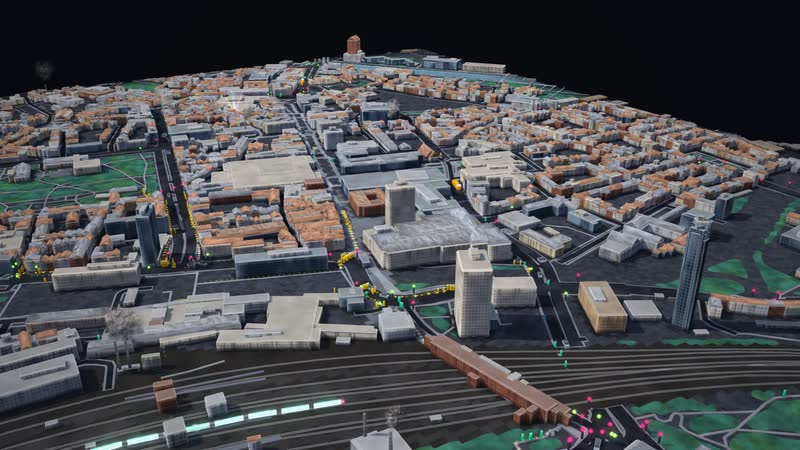
Hamburg's city centre between the town hall, the Speicherstadt and the Elbphilharmonie as a living model: people, cars, buses and trains, each with its own destination, with tunnels, water, power and data underneath – and controls that show at once how it all connects.
Trailer
Real are location, streets, buildings, tracks, stops and venues (OpenStreetMap). Traffic, service intervals, residents, jobs and network routes are model assumptions. With your data, the model shows your city and your questions.
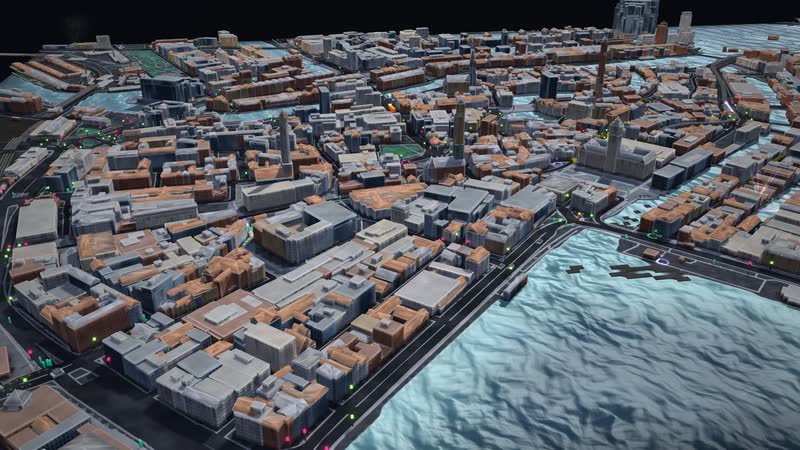
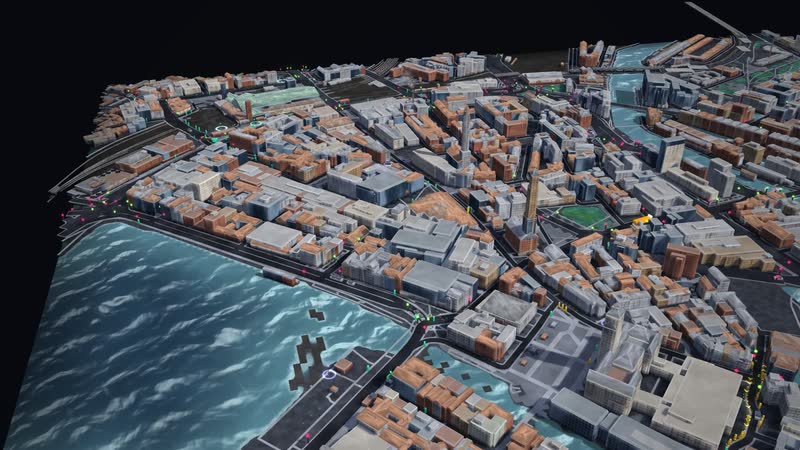
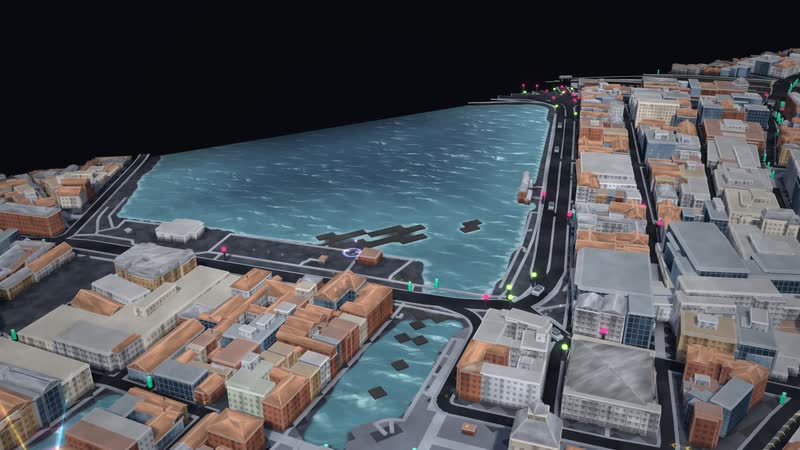
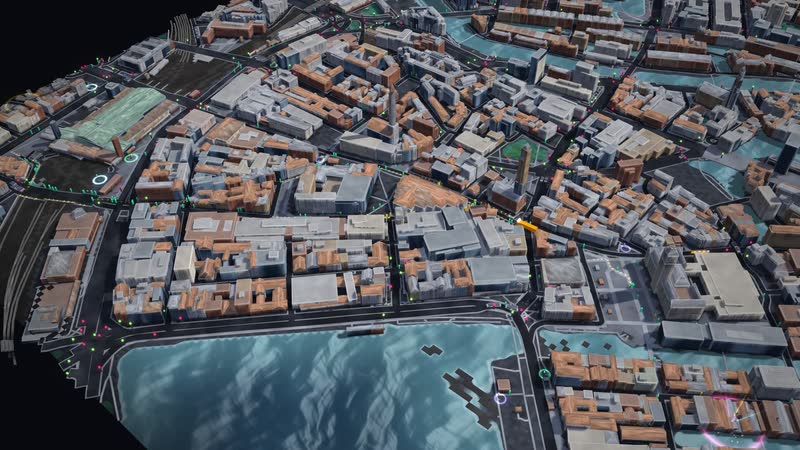
Hamburg's city centre from the main station past the town hall and Jungfernstieg to the Speicherstadt, the Elbphilharmonie and the Landungsbrücken, with the Alster, the Elbe, the Michel and the main churches. The 2.8 × 1.8 km section holds 6,861 blocks from OpenStreetMap, the tallest buildings measure 147 m. The Elbe and the Alster together take up 20% of the section, with waves, foam along the shore and bridges. People, cars and buses move through it, each with its own destination, plus U-Bahn and S-Bahn.
Controls for residents, jobs and new building, for buses, service intervals, traffic lights and a car-free centre act at once: pavements and streets fill up, trains get crowded, houses grow. The city fades out, revealing the U-Bahn and S-Bahn tunnels, water, power and data beneath. Situations such as a rail outage, congestion, a street festival or empty shops show where it gets tight first.
Real are location, streets, buildings, tracks, stops, traffic lights and venues from OpenStreetMap. Traffic, service intervals, residents and jobs per building, and the cable and pipe routes are model assumptions: the model shows connections, not a forecast. The page is for urban and transport planning, politics and public participation, schools, universities and exhibitions.
01
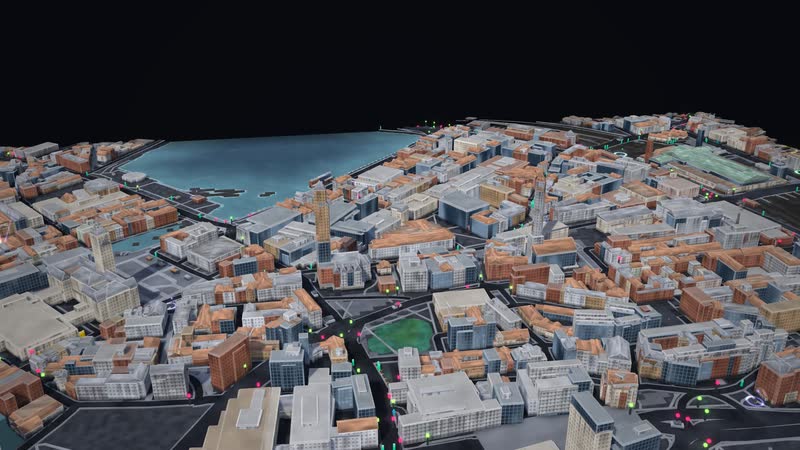
A city centre that lives
Hamburg – town hall · Speicherstadt · Elbphilharmonie: 6,861 building blocks on 5.0 km², streets, tracks and water from OpenStreetMap (as of 30 October 2026). Cars, buses, trains and people are on the move, each with a destination of their own.
02
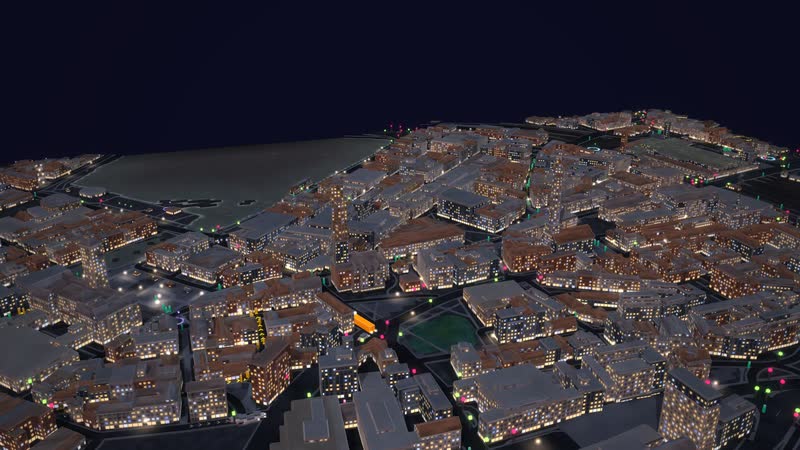
As evening falls
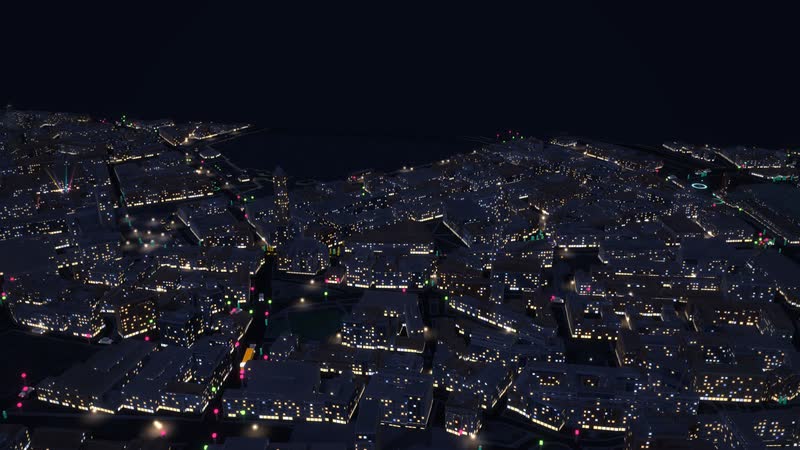
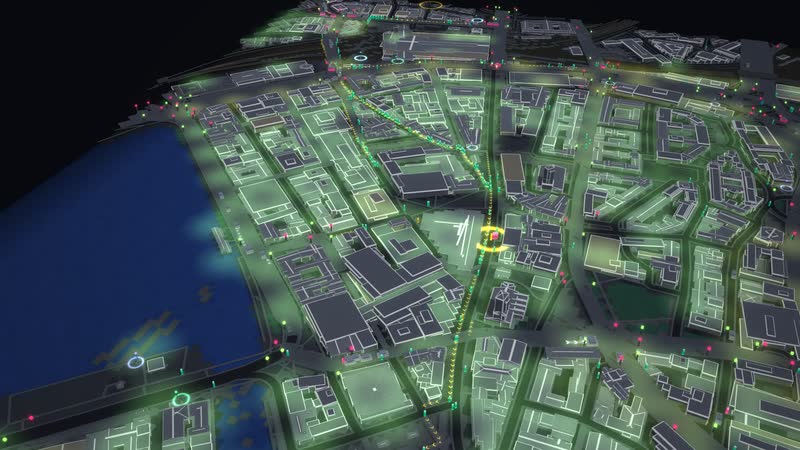
Dusk in Hamburg: the windows light up, street lights and headlights trace the streets – seen from a low angle.
What is shown – why – for whom
| What is shown | Why | For whom |
|---|---|---|
| City centre with 6,861 blocks from OpenStreetMap, from the town hall to the Elbphilharmonie, with the Elbe and the Alster | WhyShows the city as it lies on the water. | For whomplanning, exhibition |
| People, cars and buses with their own destinations | WhyShows where it gets full and where it gets tight. | For whomtransport planning |
| U-Bahn mostly in tunnels, S-Bahn partly in tunnels | WhyShows how much depends on service intervals and space on the trains. | For whompublic transport, mobility |
| Water, power and data beneath the streets | WhyShows the networks you otherwise cannot see. | For whomutilities, teaching |
| 1,884 shops, restaurants, culture and festivals from OpenStreetMap | WhyShows what makes a city centre lively. | For whomcity marketing, economic development |
| Controls with a city index for mobility, quality of living and city life | WhyShows connections, not a forecast. | For whompolitics, participation |
03
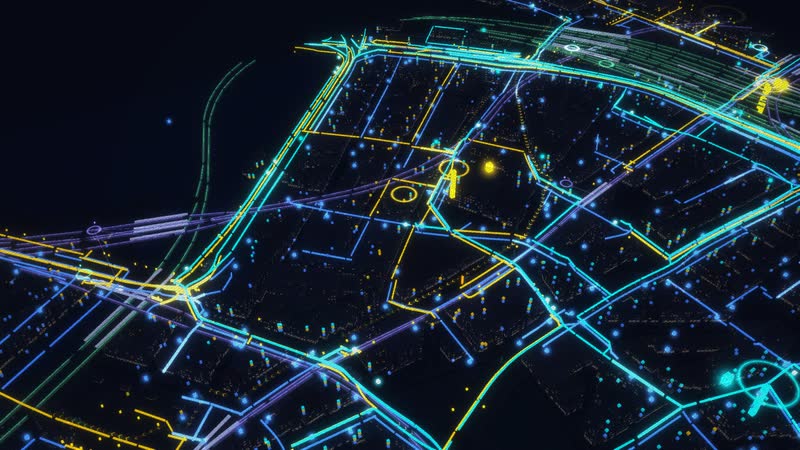
What lies beneath the city
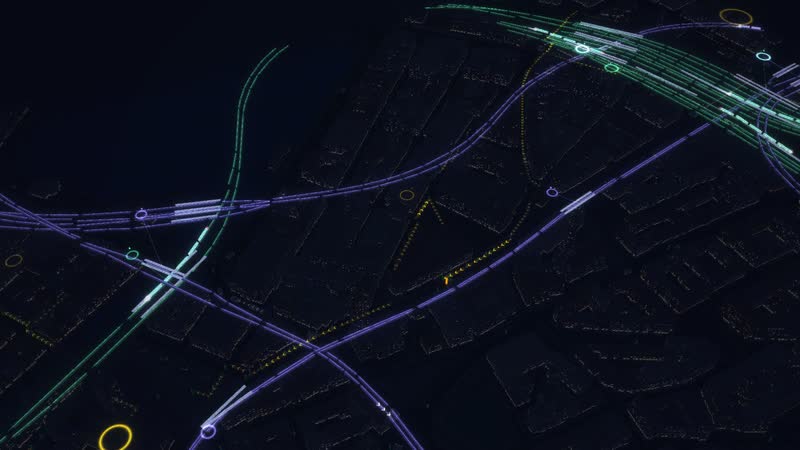
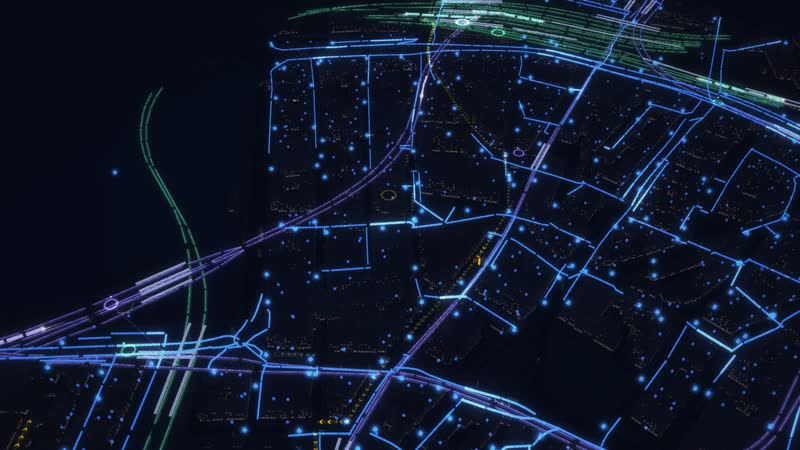
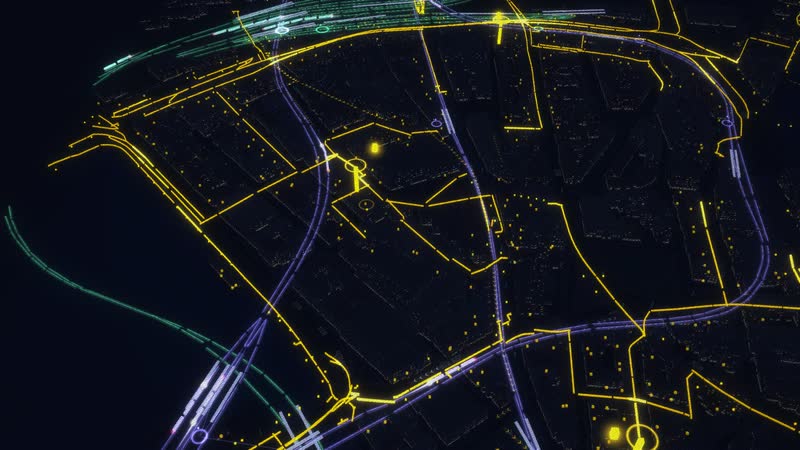
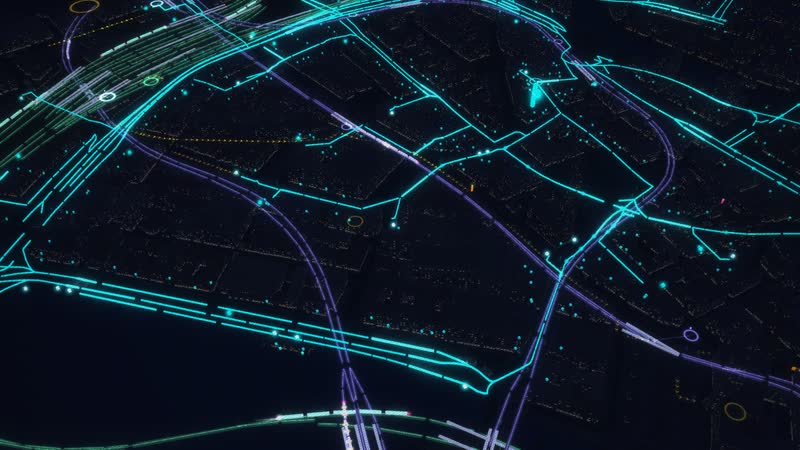
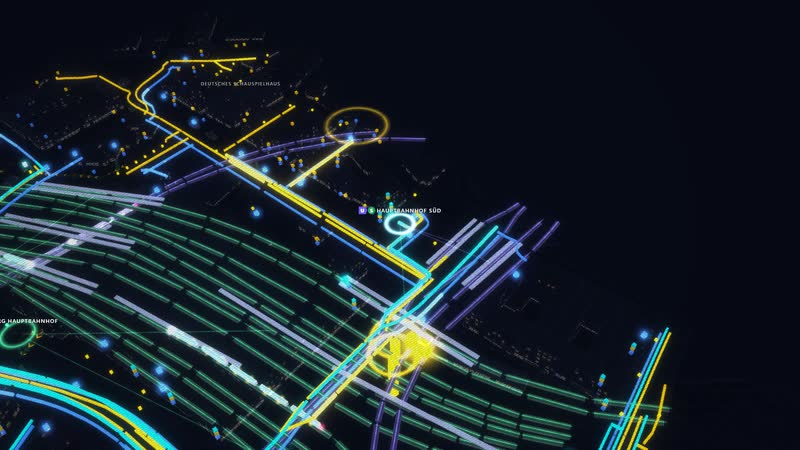
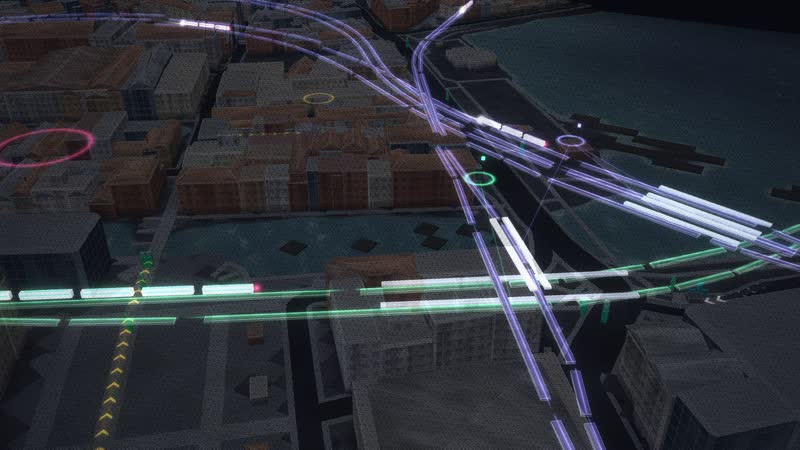
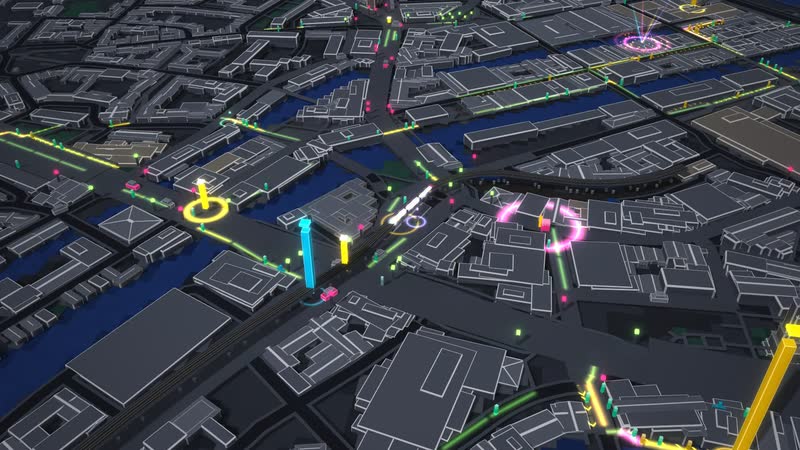
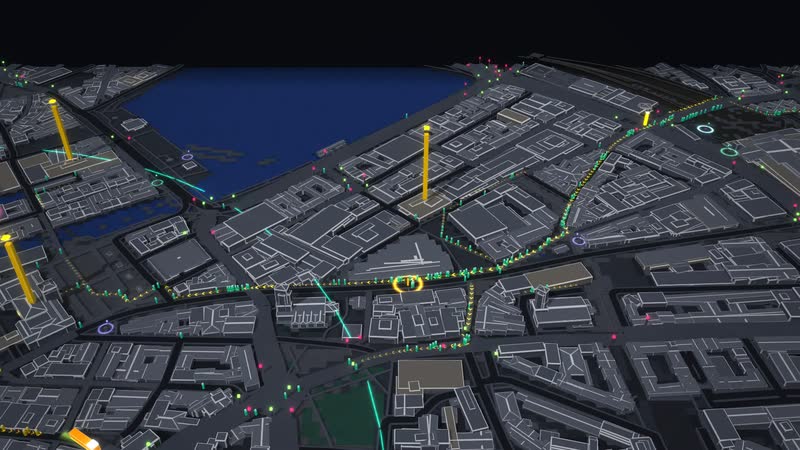
All networks at once – water blue, power yellow, data turquoise, plus the trains in their tunnels and the flows of people as bands of light.
04
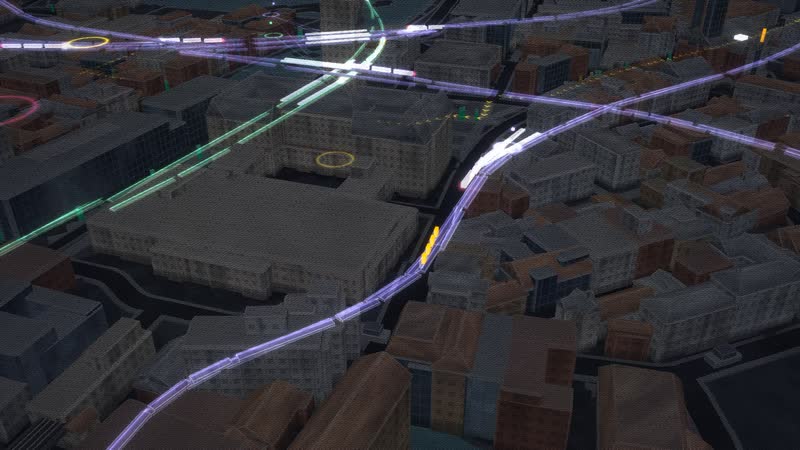
Riding along
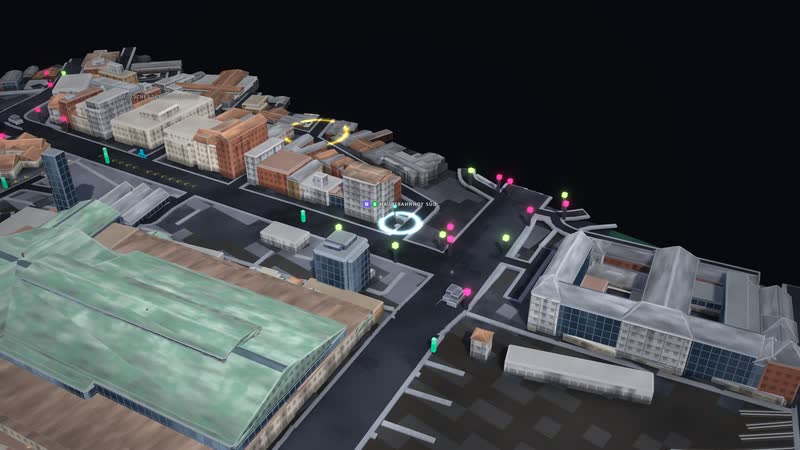
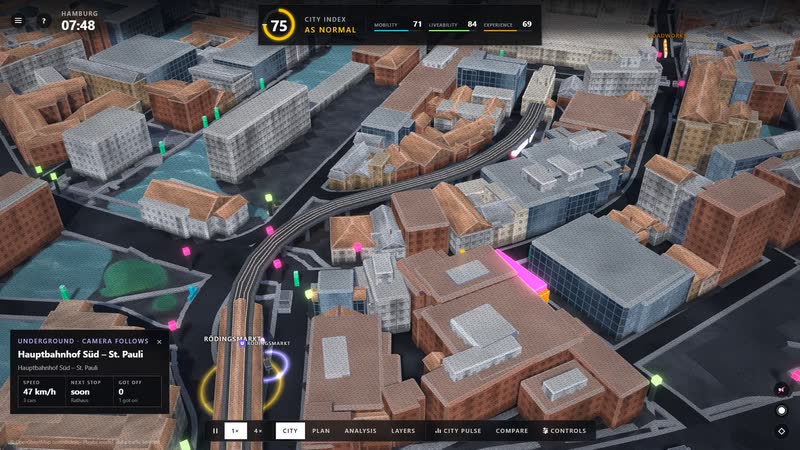
Underground: line “Hauptbahnhof Süd – St. Pauli” – the camera rides along, at every stop people get off and on.
Films from the model
-
Above Hamburg
A flight over the city centre with Elbphilharmonie and St Michael’s church – buildings made of blocks, streets, trains and people on the move.
-
From day into night
Hamburg by day, at dusk, at night and with street festivals at night – in one slow camera move: windows light up, beams of light over the squares.
-
What lies beneath Hamburg
The city fades: below the tunnels of the underground and suburban rail, then water, power and data – the points come from OpenStreetMap, the line routes are assumed.
-
Riding along
The camera rides along: first underground, then suburban rail, then a bus – at every stop people get off and on.
-
One slider – the city responds
The city builds itself from the map data, then the buildings grow by two storeys; the analysis shows residents per hectare and how switching modes and a car-free centre relieve the streets.
-
Using the software
With the full interface: controls and city index, place card, departure board at the station, following a train, analysis and layers with utilities.
City, networks and transport in the model
-
Section
town hall · Speicherstadt · Elbphilharmonie – 2,800 × 1,800 m, 5.0 km², OpenStreetMap as of 30 October 2026.
-
Landmarks
Elbphilharmonie, St Michael’s church and Hamburg town hall.
-
Buildings
6,861 building blocks, buildings up to 147 m, 27 % of the area built up, 6.2 % green; 107 named buildings and 825 places.
-
Streets
8,036 path segments and 6,610 nodes with traffic lights, zebra crossings and crossings; pavements along every street.
-
Venues
1,884 shops, restaurants, bars and clubs, cultural venues, leisure and independent scene from OpenStreetMap – each one doing well, tight, struggling or closed.
-
Water
Elbe and Alster: 20 % of the section, with waves, foam along the banks and bridges.
-
Water
623 hydrants and 26 further points from OpenStreetMap; pipes assumed under the streets.
-
Power
708 street lights, 10 substations and 2 further points from OpenStreetMap; cables drawn schematically.
-
Data
34 street cabinets, 2 exchanges, 48 antennas and 1 connection point from OpenStreetMap; the network in between is assumed.
-
Underground / Suburban rail
Tunnels of the underground and suburban rail in true depth below the city.
-
Flows
Flows of people as arrowed bands of light, visible in every view.
-
underground
4 lines through the section, 14 stations, mostly in tunnels; trains run to a timetable (model), people board and alight at every stop.
-
suburban rail
4 lines through the section, 6 stations, partly in tunnels; trains run to a timetable (model), people board and alight at every stop.
-
Bus
In the model: ring line from the station with a limited number of seats; 101 bus stops from OpenStreetMap; a full bus glows pink.
-
Cars, walking, cycling
Cars keep their distance and obey traffic lights, priority and crossing pedestrians; queues take up space. Nobody disappears.
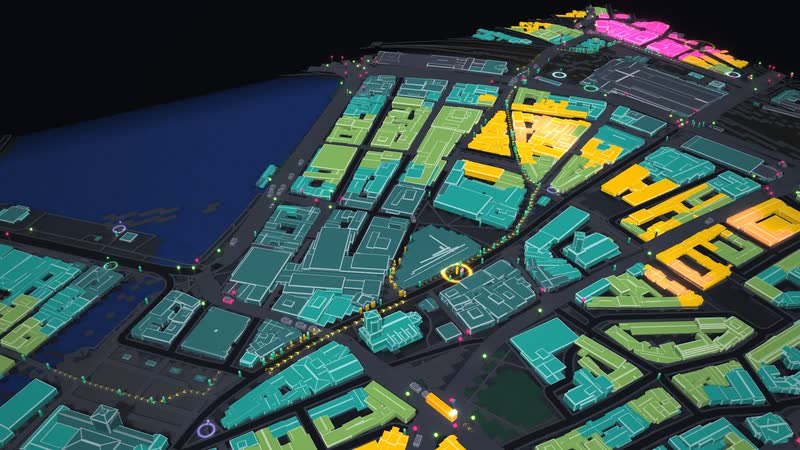
05
One slider, the whole city
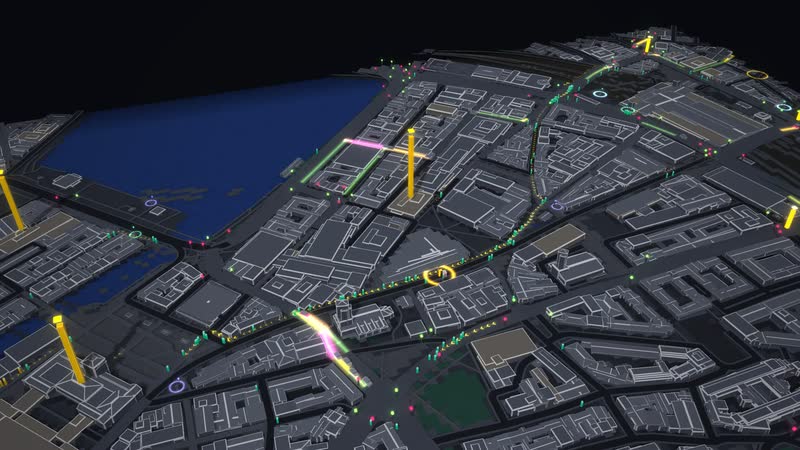
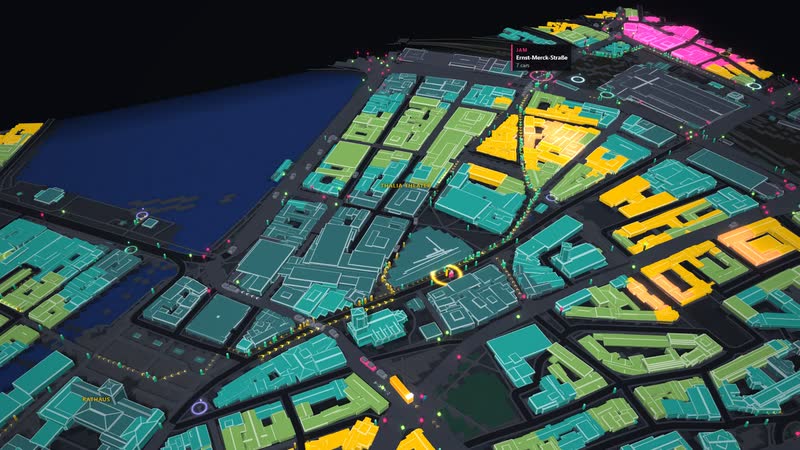
Twice as many residents – density analysis: residents per hectare, calm below 150, yellow from 300, pink above 450.
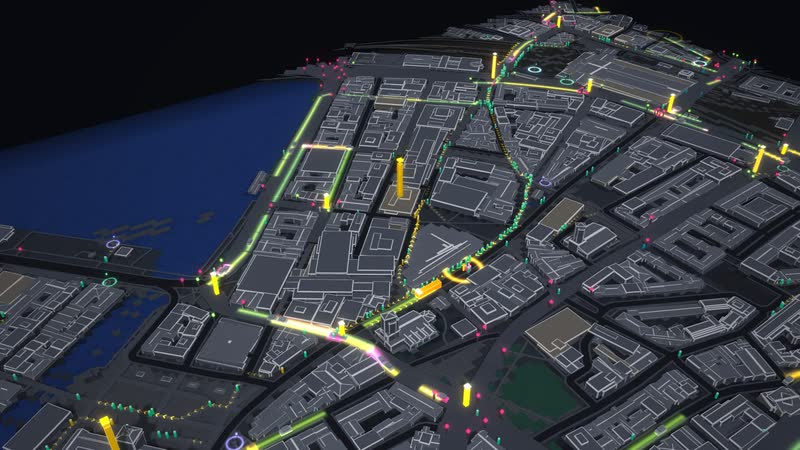
06
When the streets fill up
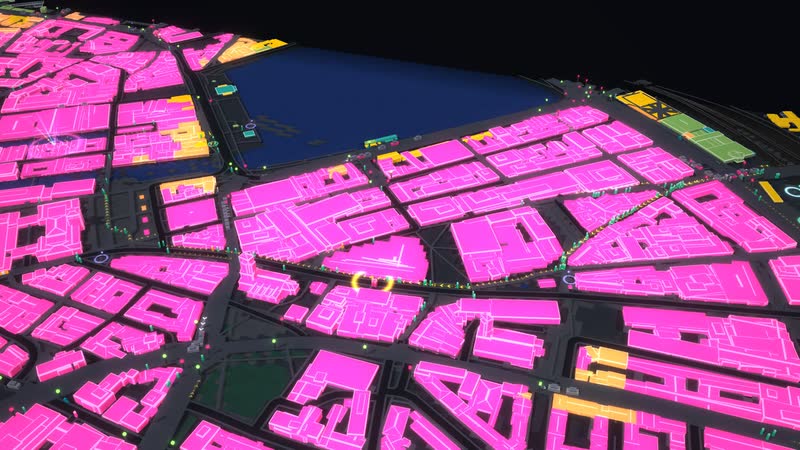
Gridlock – two and a half times the jobs, more residents and traffic lights favouring pedestrians: the streets fill up in pink.
What the model can be used for
-
Urban and transport planning
The switch to bus and rail, denser service or a car-free centre can be adjusted. The analysis colours streets and paths and shows where a decision takes effect elsewhere.
For whomurban planning, transport planning, mobility
-
A city on the water
A fifth of the section is water, and bridges cross it. You see how people between the town hall, the Speicherstadt and the Landungsbrücken are spread across U-Bahn, S-Bahn, bus and footpaths, and where flows back up at crossings.
For whomtransport planning, public transport, city marketing
-
Networks and utilities
Beneath the city lie tunnels, water, power and data. The points come from OpenStreetMap, the routes are assumed. You see how many networks a city carries.
For whomutilities, infrastructure, teaching
-
School, university, exhibition
How do living, working, transport and city life connect? The city runs around the clock, from day to night, and the demonstration also runs without anyone at the controls.
For whomschools, universities, museums and exhibitions
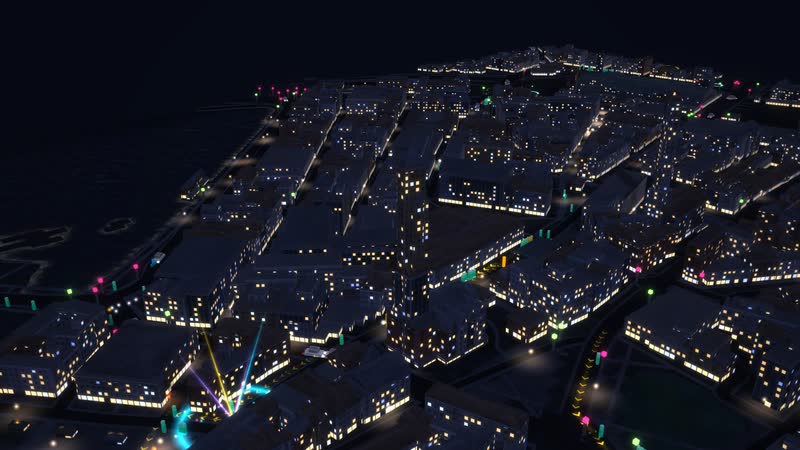
07
Festival at night
Street festival at night – stages, beams of light and crowds on the big squares of Hamburg.
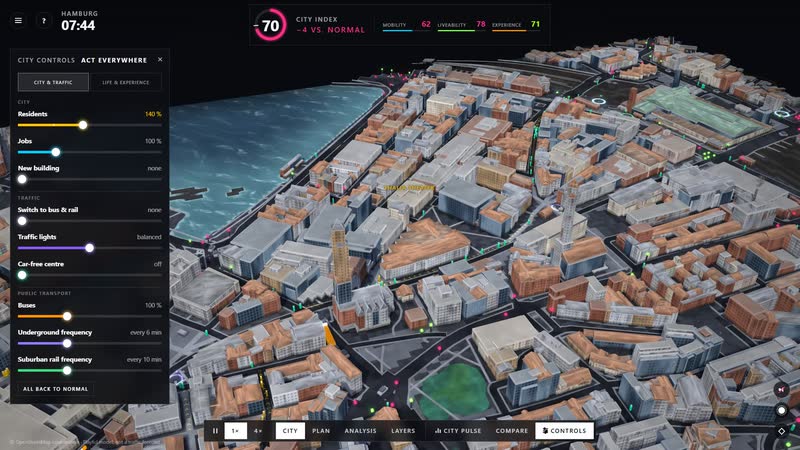
08
The whole software
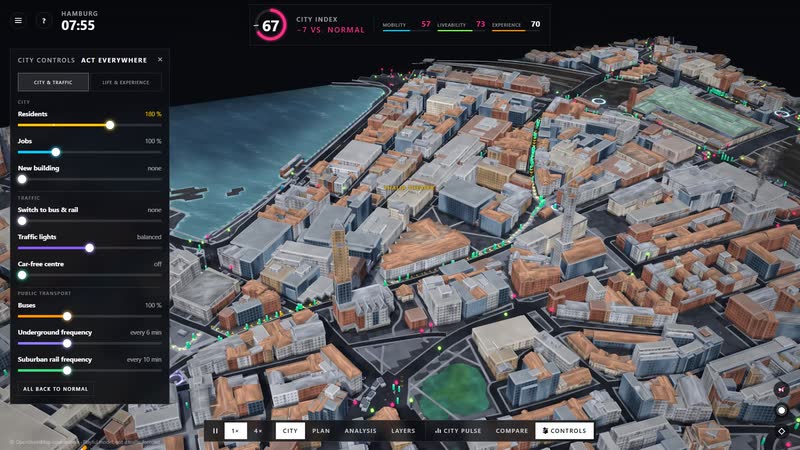
The whole software – city index at the top, city controls on the left, time of day, sound and camera on the right, views and city pulse below.
What you can change
Controls
- Residents (50–250 %): How many people live here. More people: more trips, fuller pavements and roads, less living space per head.
- Jobs (50–250 %): How many people work here. More jobs: more commuters by car and train, the centre fills up.
- New building (up to 2 storeys): Residential and mixed buildings gain storeys: more living space – the buildings visibly grow.
- Switch to bus & rail (0–80 %): Share of car trips that take the bus and train instead. Frees the roads – needs room on the trains.
- Traffic lights (priority cars ↔ pedestrians): Long cycles for cars or short ones, with all-way walk, for pedestrians.
- Car-free centre (radius 0–900 m): Radius around the centre: cars park outside, buses run, pedestrians cross freely.
- Buses (0–300 %): How many buses run – room for people who switch.
- Underground frequency (off to triple, normally every 6 min): How often underground, light rail and trams run. More often: shorter waits, more passengers, fewer cars. Here: underground.
- Suburban rail frequency (off to triple, normally every 10 min): How often suburban and regional trains run. Off: nobody arrives by train, more cars. Here: suburban rail.
- Shops (0–200 %): How many shops are open. Fewer: empty units, worse supply, more people drive out by car.
- Food & drink (0–200 %): Restaurants and cafés. Need guests – residents, workers, visitors; with noise nobody sits outside.
- Bars & clubs (0–200 %): Nightlife: makes the city worth experiencing – but loud for the neighbours at night.
- Culture (0–200 %): Museums, theatres, cinemas, concerts. Attract visitors.
- Independent scene (0–200 %): Cultural centres, studios, community arts – small but important for the experience.
- Street festivals (0–3): Festivals and events on the big squares: stage, lights, crowds.
Situations
- Fire: Now and then a house in view catches fire: the flames grow, burn for about a minute and smoke drifts over the district (model).
- Gridlock: More jobs and residents, traffic lights favouring pedestrians: cars queue, the analysis turns the streets pink.
- Rail shutdown: Both frequency controls off: the underground and suburban rail stop, nobody arrives by train, more cars push into the city.
- Street festival: Festivals and events on the big squares: stage, lights, crowds. Experience rises, nights get louder.
- Clubs closed: Bars and clubs set to zero: the venues turn grey, experience drops, nights get quieter for the neighbours.
- Empty shops: Fewer residents and only a third of the shops open: shops and restaurants struggle (lens venues: pink struggling, grey closed), more people drive out by car.
- Roadworks: The scenario generator closes a much-used path for over half an hour when there is a detour.
- Dusk and night: Time of day (key N): windows, street lights and headlights come on; the clock runs from 18:30 or 22:30.
What the model brings
-
01
The real city on the Elbe and Alster as a stage
Streets, houses, tracks and bodies of water come from OpenStreetMap. You show Hamburg with the town hall, the Michel and the Elbphilharmonie as it lies, not as a diagram.
-
02
See the effect at once
Every control acts immediately: pavements, streets and trains fill up or empty, and the analysis shows where.
-
03
Situations without damage
Rail outage, congestion, a street festival or empty shops can be triggered. You see where it gets tight first, and set it back.
-
04
For big screens and the browser
Runs in the browser and on large projections, from day to night, with a demonstration that starts without anyone at the controls.
-
Hamburg – town hall · Speicherstadt · Elbphilharmonie: 6,861 building blocks on 5.0 km², streets, tracks and water from OpenStreetMap (as of 30 October 2026). Cars, buses, trains and people are on the move, each with a destination of their own. -
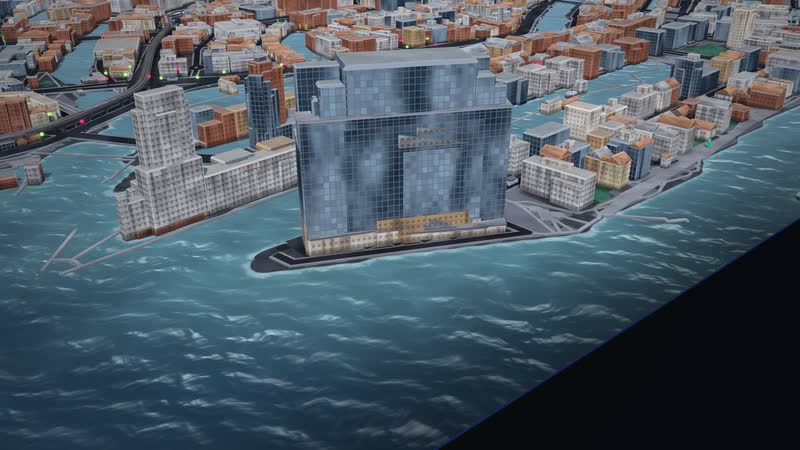
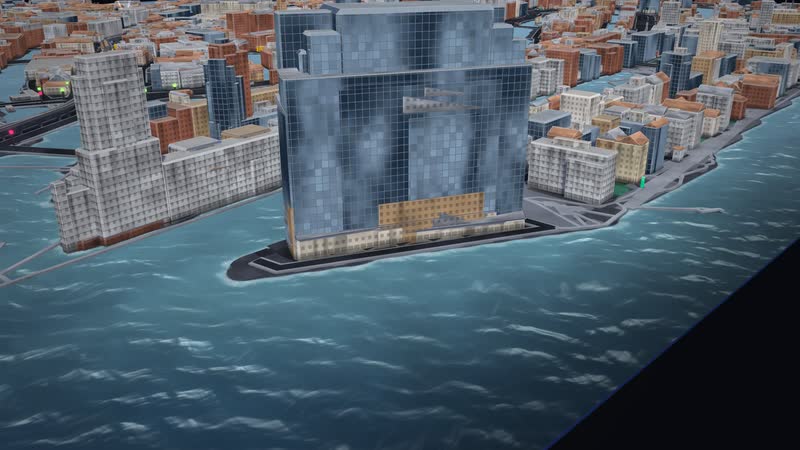
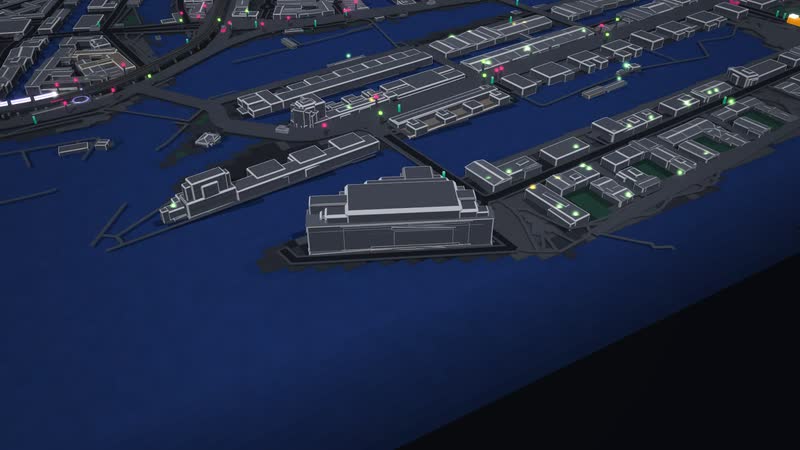
Hamburg from the other side – with Elbphilharmonie and St Michael’s church. Buildings up to 147 m tall. -
Across the light – the sun stands in the south-west; building heights come from OpenStreetMap or are estimated by building type, the footprints split into blocks. -
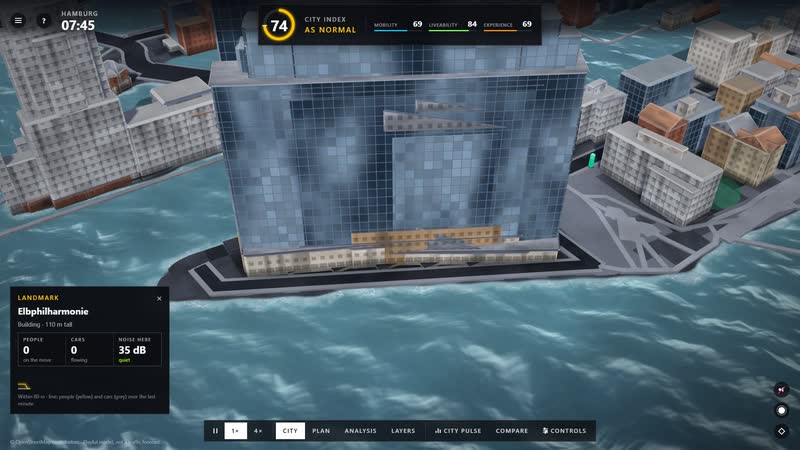
Elbphilharmonie – medium shot; around it 107 named buildings and 825 places from OpenStreetMap. -
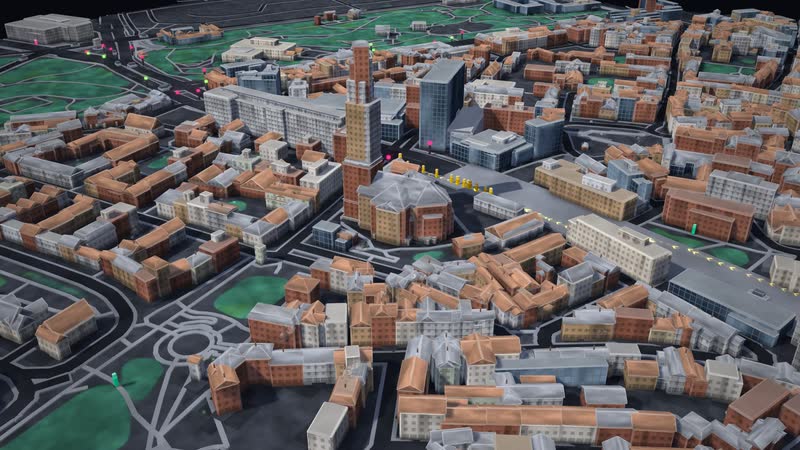
St Michael’s church in the urban fabric – streets as blocks, pavements along every street, 8,036 path segments in the network. -
Dusk in Hamburg: the windows light up, street lights and headlights trace the streets – seen from a low angle. -
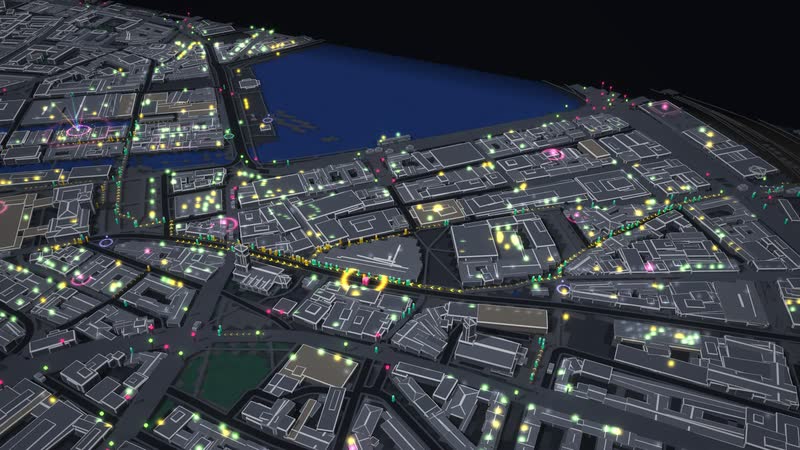
Night in Hamburg: only windows, street lights and headlights – the city keeps running around the clock. -
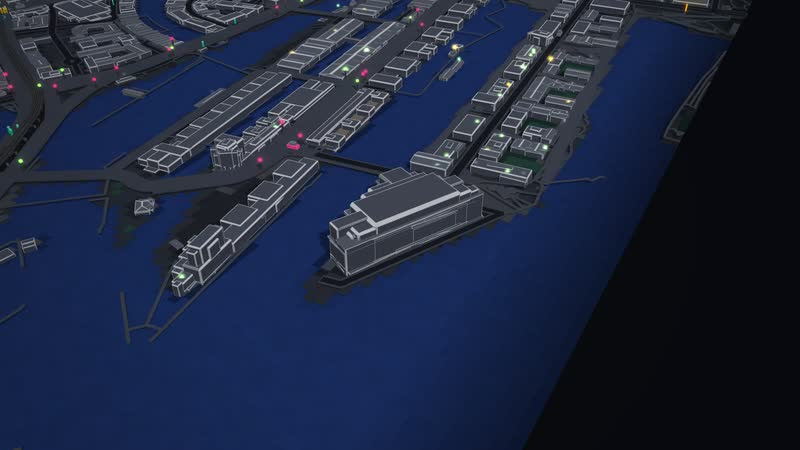
Elbe and Alster – waves, foam along the banks and bridges; the water areas (20 % of the map) come from OpenStreetMap. -
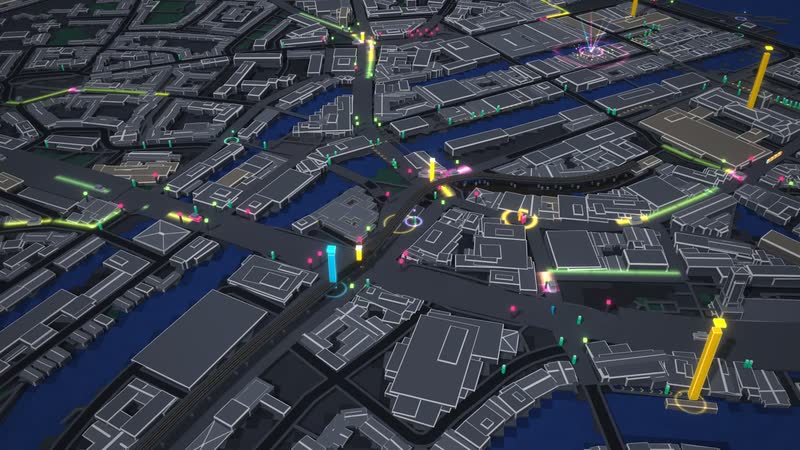
From above at an angle – the street network with 6,610 nodes, plus traffic lights, zebra crossings and crossings from OpenStreetMap. -
Layers: the city becomes a veil, below lie the tunnels of the underground and suburban rail – 16 stations on the map. -
Water beneath Hamburg: 623 hydrants and 26 further points from OpenStreetMap; the pipes are assumed, under the streets. -
Power: 708 street lights, 10 substations and 2 generators from OpenStreetMap – the cables drawn schematically under the streets. -
Data: 34 street cabinets, 2 exchanges, 48 antennas and 1 connection point from OpenStreetMap; the network in between is assumed. -
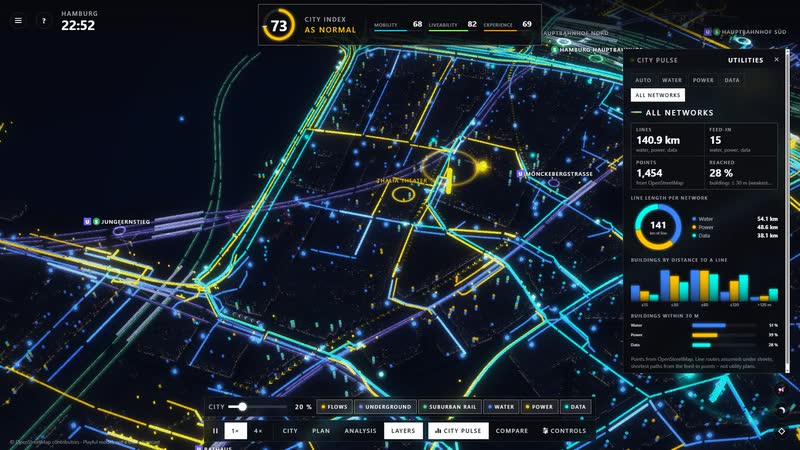
All networks at once – water blue, power yellow, data turquoise, plus the trains in their tunnels and the flows of people as bands of light. -
Layers with names – the stations of the underground and suburban rail stand above the tracks; in the layers they are always visible. -
Underground: line “Hauptbahnhof Süd – St. Pauli” – the camera rides along, at every stop people get off and on. -
Suburban rail: line “Jungfernstieg – Stadthausbrücke” – the camera rides along, at every stop people get off and on. -
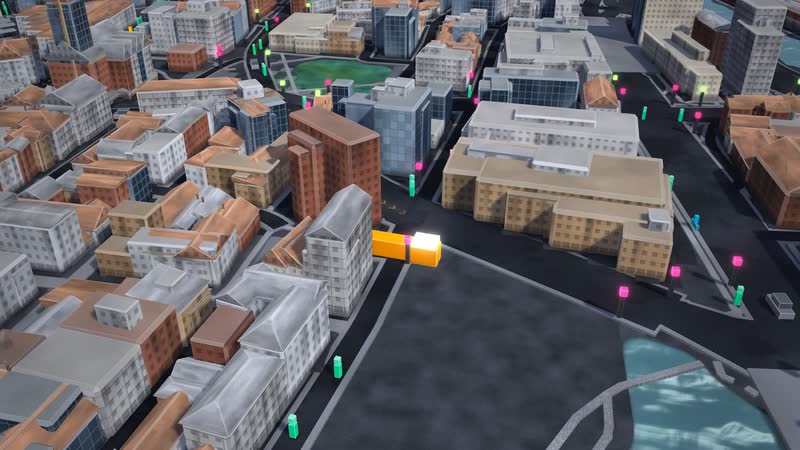
Bus – the camera rides along; at every stop people get on and off, and when it is full it glows pink. -
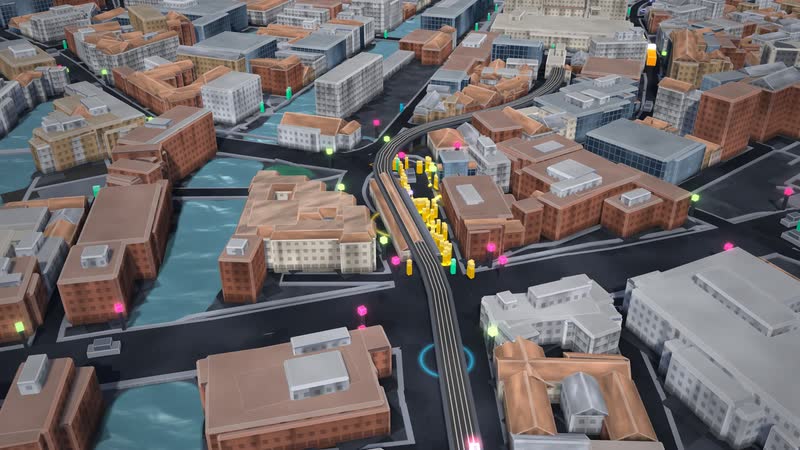
At the main station: a train arrives and hundreds get off – in yellow they find their way into the city. -
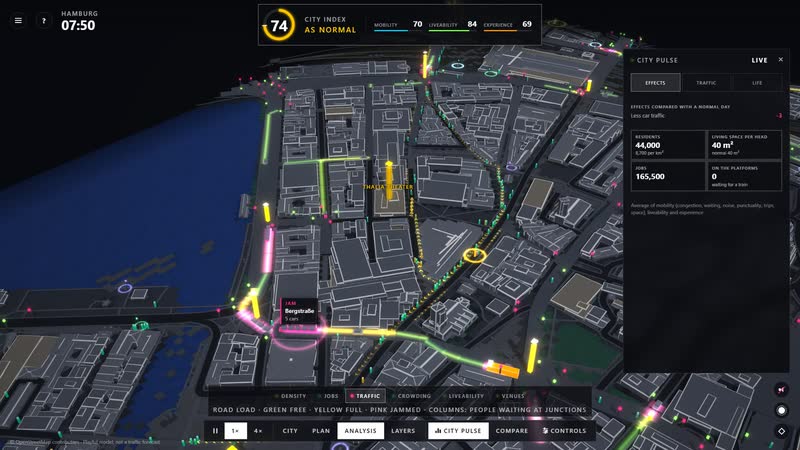
Traffic analysis in Hamburg – green free, yellow full, pink jammed; columns show the people waiting at junctions. -
Crowding analysis – people on the pavements, rings for those waiting at lights and platforms; pink means the train was full. -
Stations labelled – 16 stops of the underground and suburban rail on the map, plus arrivals and walks at the station. -
New building – residential and mixed buildings gain two storeys, Hamburg visibly grows. -
Twice as many residents – density analysis: residents per hectare, calm below 150, yellow from 300, pink above 450. -
Twice as many jobs – jobs analysis: yellow from 500, pink above 900 per hectare; that is where the city commutes to. -
Liveability per neighbourhood – pink poor, yellow medium, green good; behind it supply, food and drink, culture, nightlife, leisure, green, quiet and space. -
Venues of the city – 1,884 shops, restaurants, clubs, cultural venues and meeting places from OpenStreetMap; green doing well, yellow tight, pink struggling, grey closed. -
A car-free centre with a 600 m radius and 60 % switching to bus and rail – the streets turn green, the trains get fuller. -
Hot spots with names and figures – where it is densest and busiest is shown right above the city. -
City controls and city index – nine levers for the city and its traffic, at the top the index of mobility, liveability and experience, measured against a normal day. -
Gridlock – two and a half times the jobs, more residents and traffic lights favouring pedestrians: the streets fill up in pink. -
Rail shutdown – the underground and suburban rail stand still, nobody arrives by train any more, more cars push into the city. -
Street festival at night – stages, beams of light and crowds on the big squares of Hamburg. -
Clubs and bars closed, only a quarter of restaurants open – the venues turn grey, the experience drops, nights get quieter. -
Empty shops – half the residents, only 30 % of shops open: shops and restaurants struggle, the city empties. -
The whole software – city index at the top, city controls on the left, time of day, sound and camera on the right, views and city pulse below. -
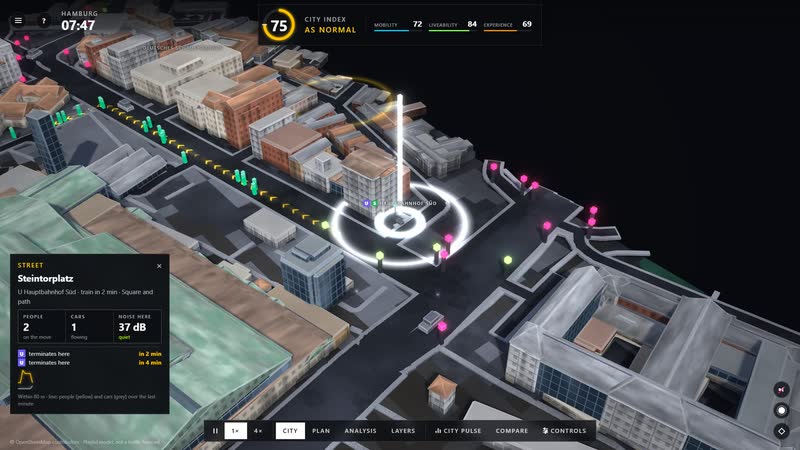
Click into the city – the place card names the spot and shows people, cars and noise with a small trend line. -
At the station – the departure board shows line, destination and minutes, plus the people waiting and the next train. -
Train tapped – the camera rides along, the card names line, destination, next stop, speed and passengers. -
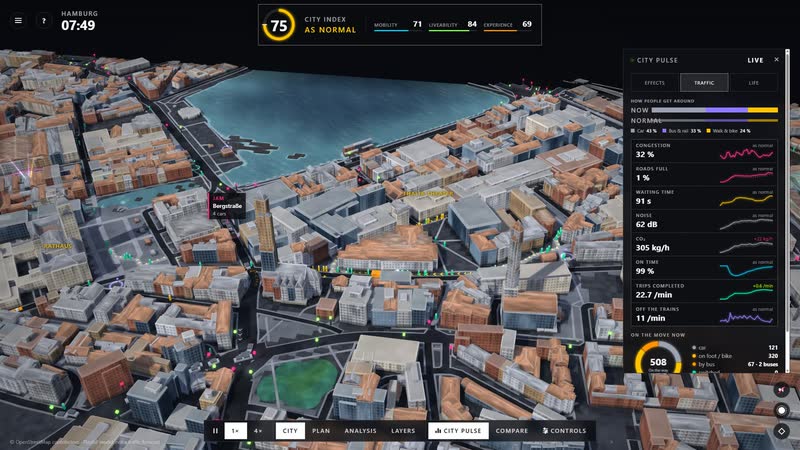
City pulse – congestion, waiting time, noise, CO₂, punctuality and completed trips, each compared with a normal day. -
Analysis with legend – lenses for density, jobs, traffic, crowding, liveability and venues, the city pulse on the right. -
Layers with toolbar and utilities panel – line length, points from OpenStreetMap, distance of buildings and coverage per network. -
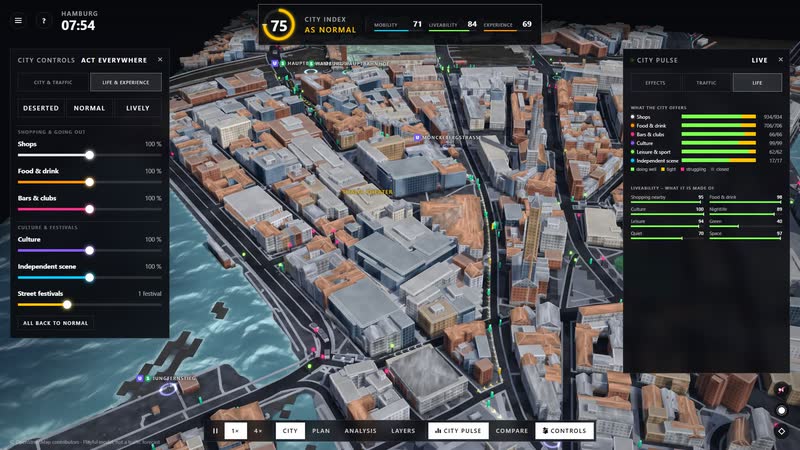
Life and experience – shops, food and drink, clubs, culture, the independent scene and street festivals as controls of their own, their effect on the right. -
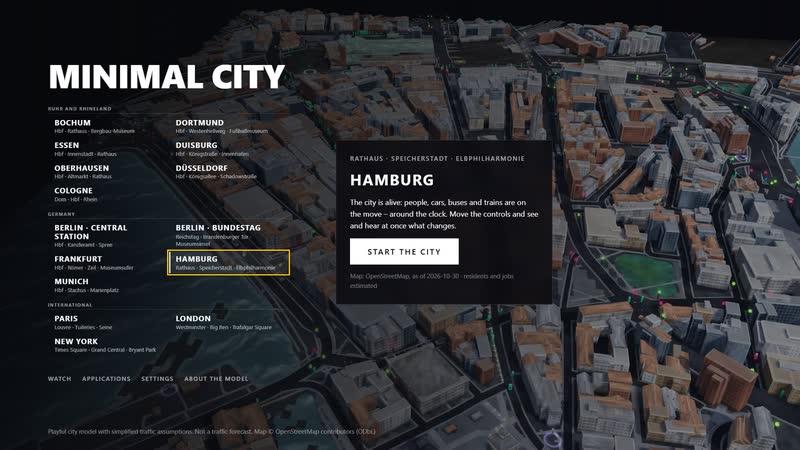
Choosing a city – 15 city centres from Bochum to New York, each from OpenStreetMap; here Hamburg is selected. -
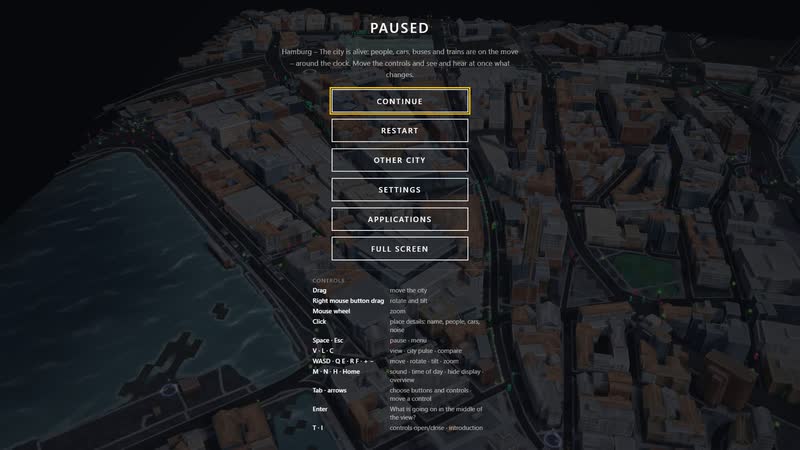
Pause with controls – mouse, keyboard and touch: drag, rotate, zoom, change view, time of day with N.
Your city as a model
Would you like to show your city centre, your neighbourhood or your transport question like this? Write to us or call. We will send you the password for starting it on request.
cube4tec.de/spiele/minimal-city/
Ask about this
Minimal City: Hamburg · Rathaus, Speicherstadt und Elbphilharmonie
Basis and limits
Real are the location, the street and path network, building footprints and heights (where mapped, otherwise estimated by building type), tracks, stops, traffic lights, venues and utility points of Hamburg – from OpenStreetMap, as of 30 October 2026. Traffic, demand, timetables, signal plans, residents and jobs as well as the utility line routes are model assumptions: the game shows relationships, not a traffic forecast.
Public sources the model is based on:
- OpenStreetMap contributors, ODbL 1.0 – data as of 30 October 2026
- Overpass API (one-off retrieval of the OSM data)
- Model assumptions: demand, timetables, signal plans, capacities, residents and jobs per building, utility line routes
More cities in the model
-
Berlin · Central Station, Chancellery and the Spree
Berlin around the Central Station as a living model: people, cars, buses and trains, each with its own destination, with tunnels, water, power and data underneath – and controls that show at once how it all connects.
-
Berlin · Bundestag, Unter den Linden and Museum Island
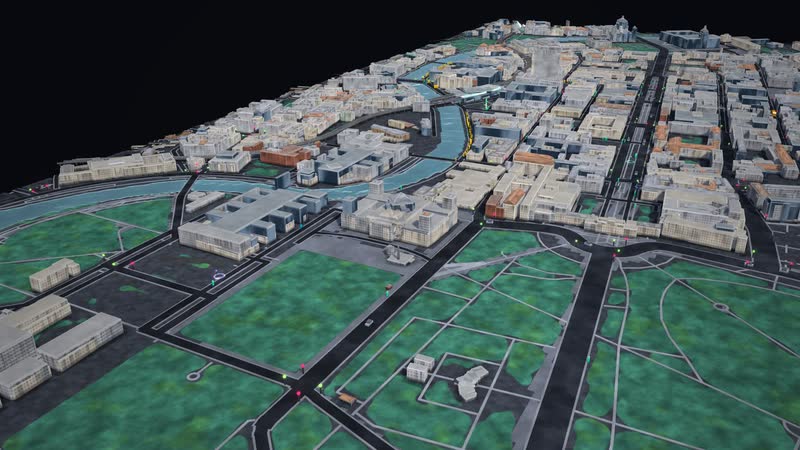
Berlin's centre from the Reichstag building to Museum Island as a living model: people, cars, buses and trains, each with its own destination, with tunnels, water, power and data underneath – and controls that show at once how it all connects.
-
Frankfurt · city centre with Römer, Zeil and the Main
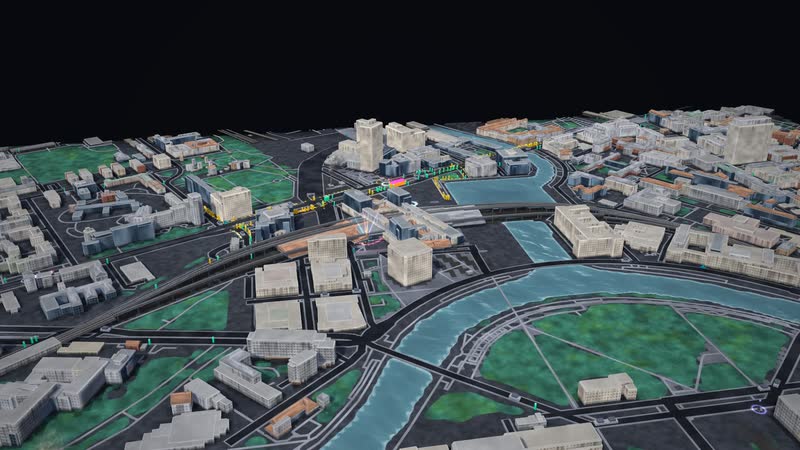
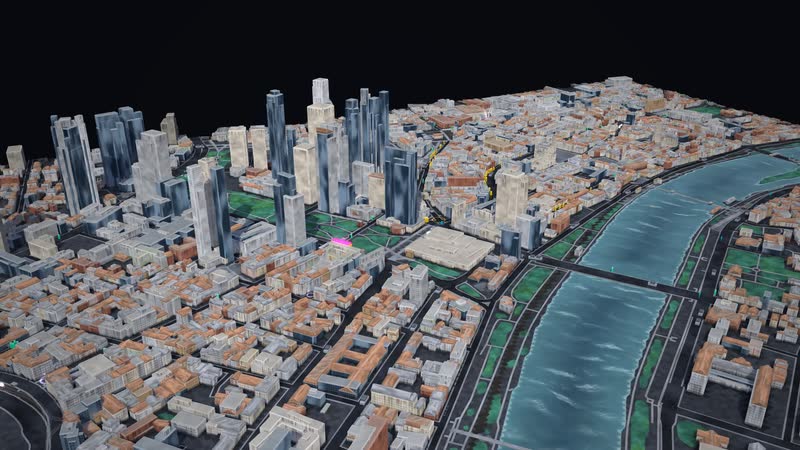
Frankfurt's city centre between the main station, the Römer, Zeil and the Main as a living model: people, cars, buses and trains, each with its own destination, with tunnels, water, power and data underneath – and controls that show at once how it all connects.
-
Munich · old town with Stachus and Marienplatz
Munich's old town between the main station, Stachus, Marienplatz and Odeonsplatz as a living model: people, cars, buses and trains, each with its own destination, with tunnels, water, power and data underneath – and controls that show at once how it all connects.
-
Bochum · city centre with town hall and Mining Museum
Bochum's city centre as a living model: people, cars, buses and trains, each with its own destination, with tunnels, water, power and data underneath – and controls that show at once how it all connects.
-
Dortmund · city centre with Westenhellweg
Dortmund's city centre inside the Wallring as a living model: people, cars, buses and trains, each with its own destination, with tunnels, water, power and data underneath – and controls that show at once how it all connects.
-
Essen · city centre with main station and town hall
Essen's city centre between the main station and the town hall as a living model: people, cars, buses and trains, each with its own destination, with tunnels, water, power and data underneath – and controls that show at once how it all connects.
-
Duisburg · city centre with Königstraße and inner harbour
Duisburg's city centre from the main station to the inner harbour as a living model: people, cars, buses and trains, each with its own destination, with tunnels, water, power and data underneath – and controls that show at once how it all connects.
Real are location, streets, buildings, tracks, stops and venues (OpenStreetMap). Traffic, service intervals, residents, jobs and network routes are model assumptions. With your data, the model shows your city and your questions.