
Simulation · Minimal Energy · Coal and nuclear
Hamm-Uentrop
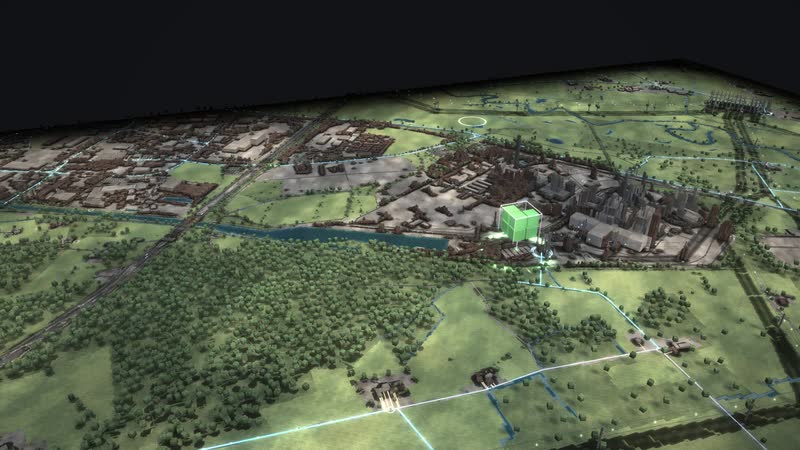
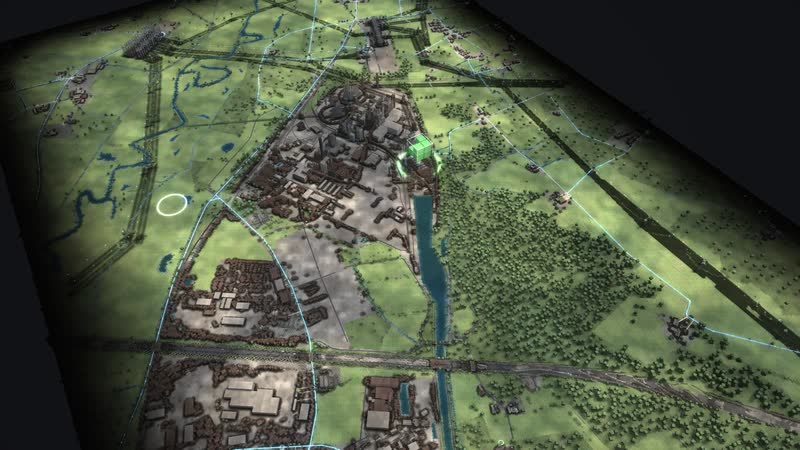
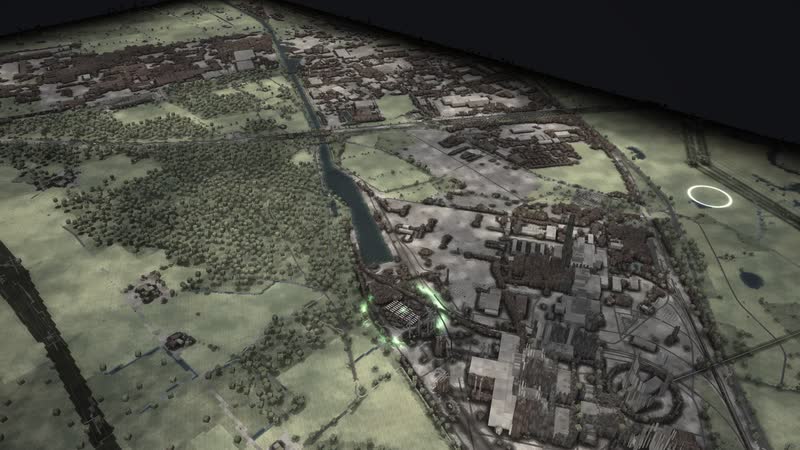
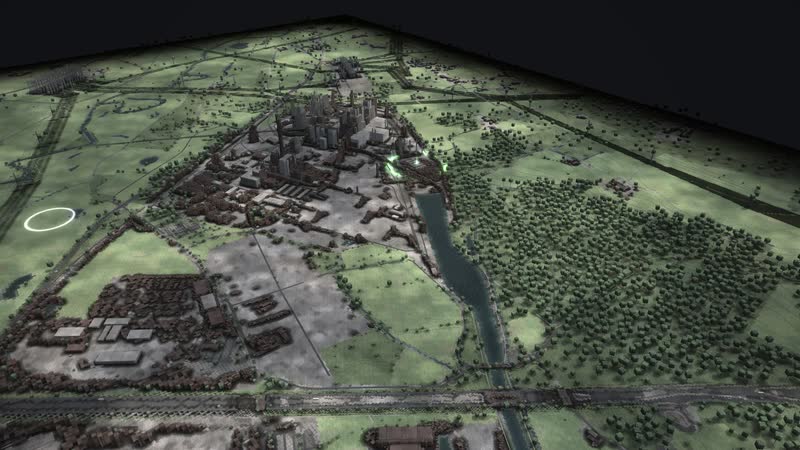
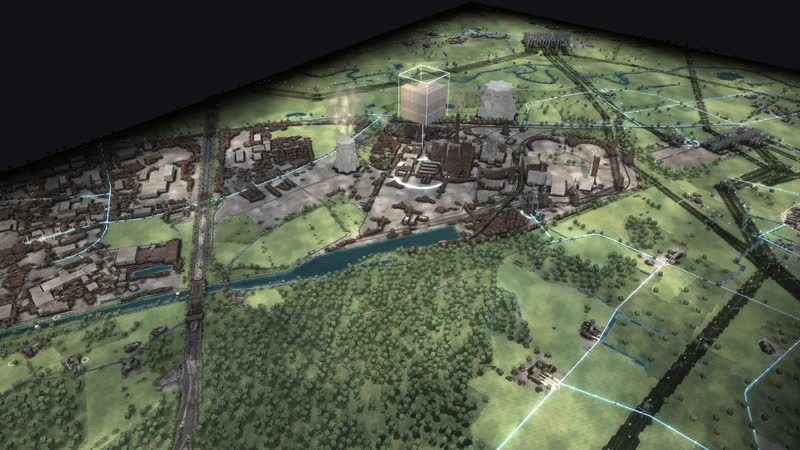
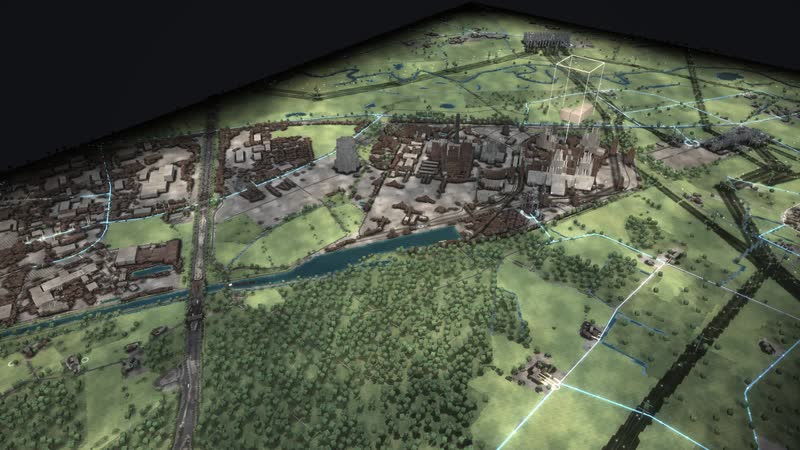
Five decades of energy on the Lippe and the canal as a walkable model: the THTR-300 thorium reactor, the Westfalen hard-coal plant, a gas plant, a large battery – and soon direct current from Wilhelmshaven.
Trailer
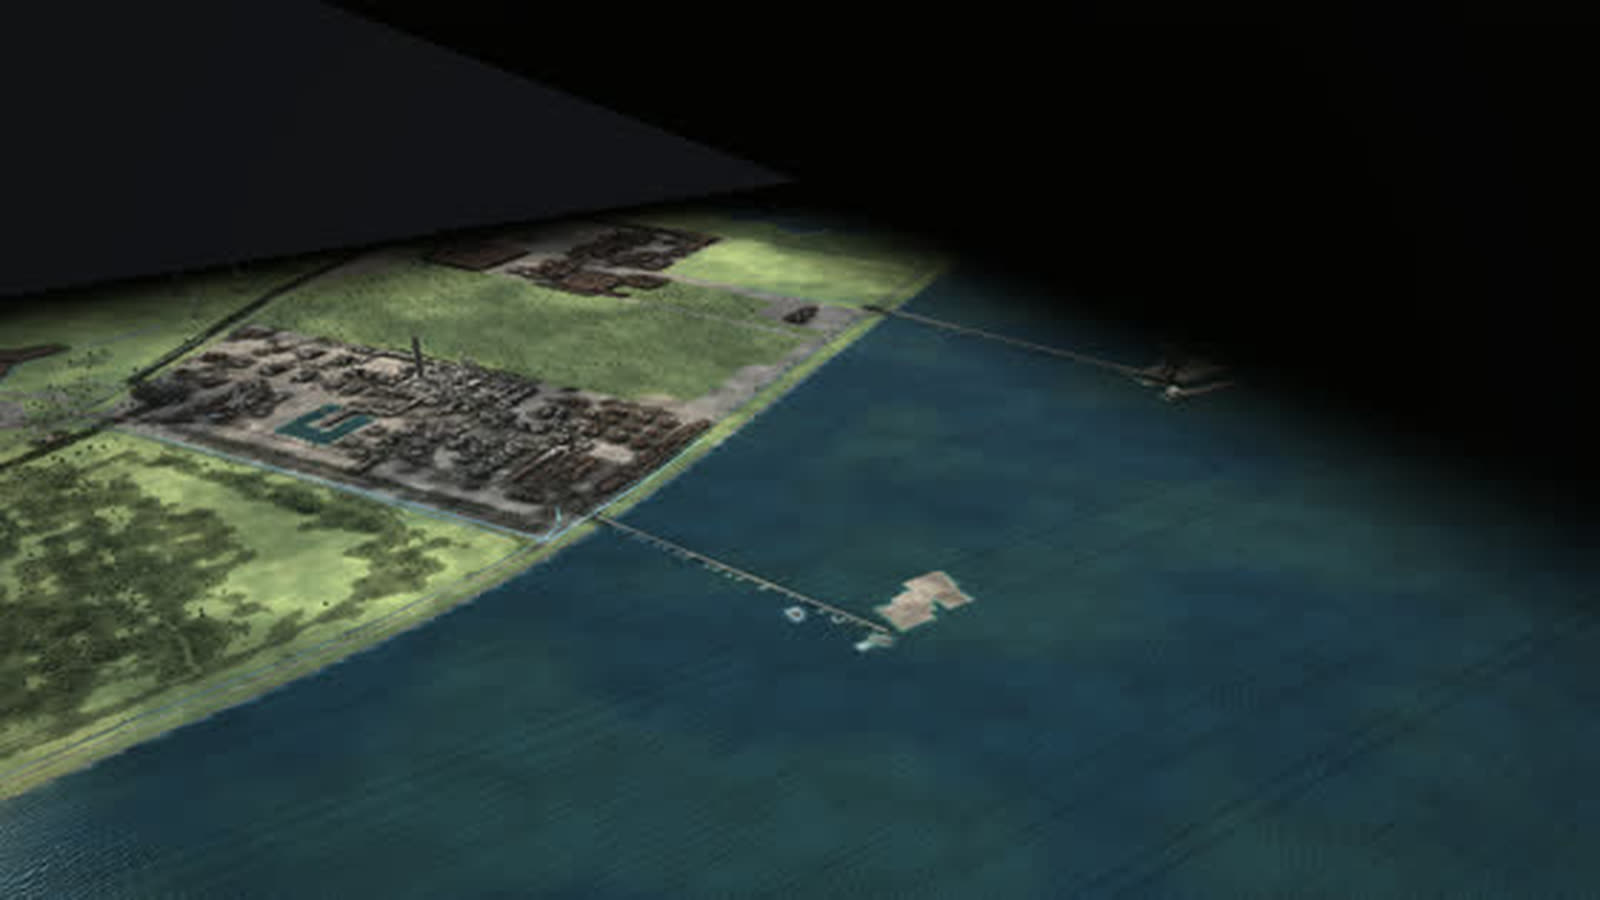
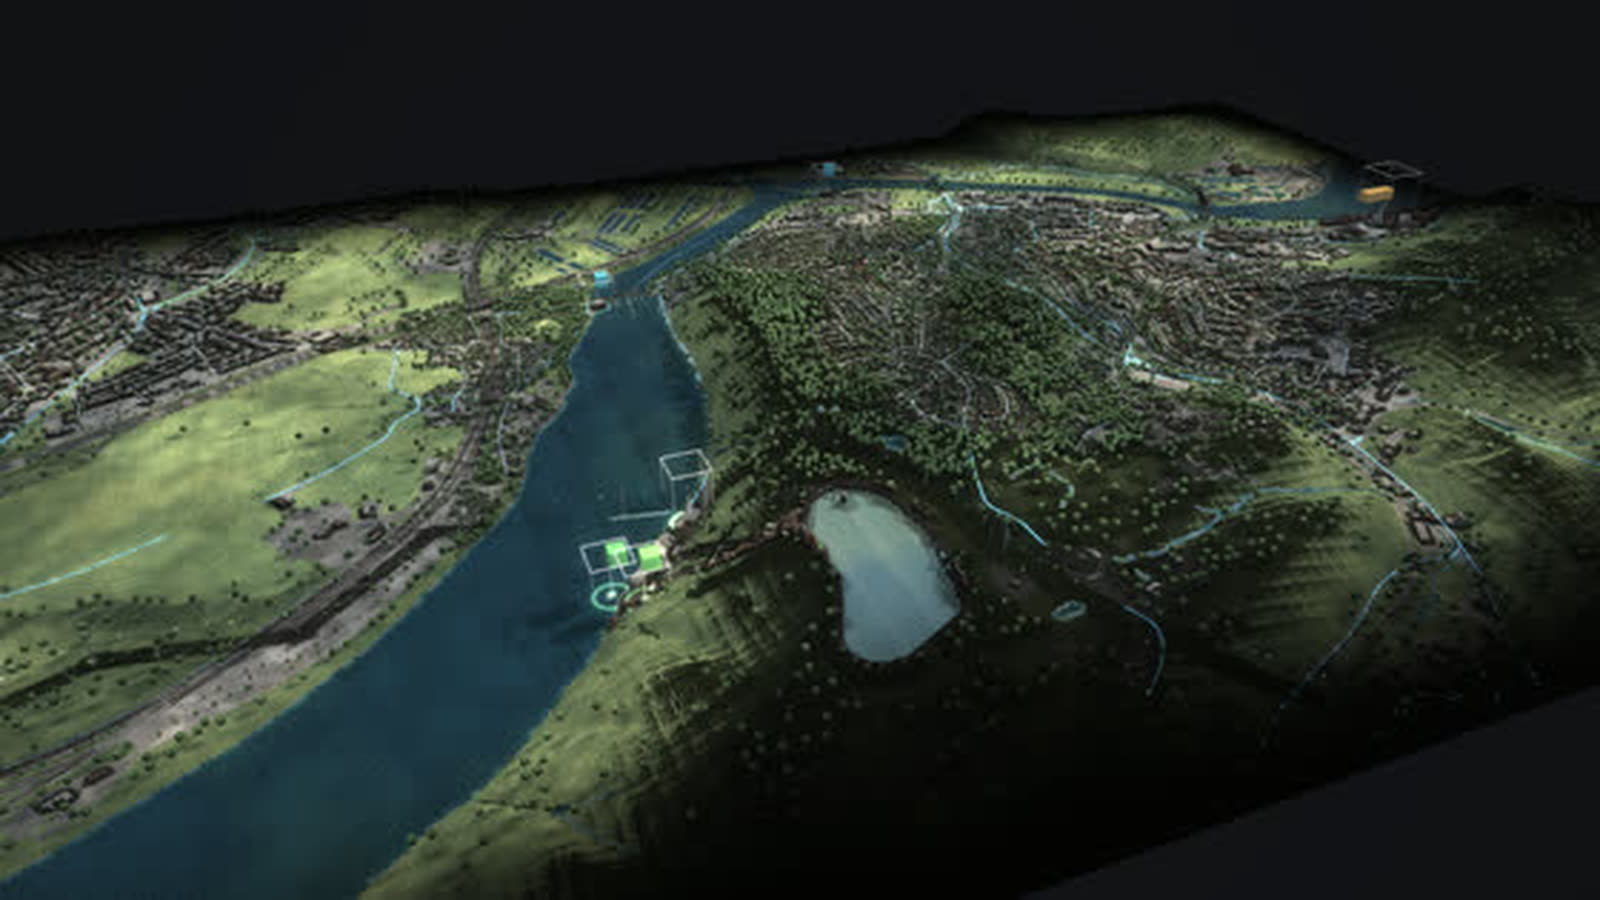
Real are terrain and buildings (Geobasis NRW, OpenStreetMap) and the plants with capacity and years. The position of the THTR and unit C cooling towers, the ship traffic and the cooling water are schematic, and the site of the planned converter is approximate; output now and CO₂ come from the model. With your data it shows more, such as the schedules of gas plant and battery or the expansion of the grid node.
The THTR-300 in Hamm-Uentrop was a thorium high-temperature reactor with 296 MW net: fuel in graphite pebbles, cooled with helium. It delivered its first power on 16 November 1985 and was shut down on 29 September 1988 after only 423 full-load days; it has been safely enclosed since 1997. Its cable-net cooling tower cooled with air instead of water, without a plume, and was demolished in 1991.
Next to it stand fifty years of coal: units A and B of the Westfalen plant ran from 1963, unit C from 1969, and ships brought the coal along the Datteln-Hamm Canal right up to the plant. The new units D and E came late: unit E only ran from 2014 to 2020 and was the first plant to leave the market in the coal phase-out auction, while unit D was damaged by hydrochloric acid in 2013 and never ran.
Today the gas plant with two 425 MW units ramps up within minutes when wind and sun are lacking; since December 2024 a battery with 140 MW and 151 MWh has stored power on the plant site. Via the Uentrop substation, one of the large grid nodes of Westphalia, and the Lippborg station, wind power from Wilhelmshaven is to arrive as direct current from about 2030. For operators, grid planners, municipalities, chambers, schools and museums.
The chain of the place
- 01
Thorium reactor: Graphite pebbles with thorium and uranium, cooled with helium: on the grid in 1985, shut down in 1988 after 423 full-load days, safely enclosed since 1997.
- 02
Dry cooling: The cable-net cooling tower cooled with air instead of water, without a plume; it was demolished in 1991.
- 03
Coal by canal: Ships brought the coal along the Datteln-Hamm Canal right up to the plant, belts carried it to the boilers.
- 04
Briefly online: Unit E only ran from 2014 to 2020: it was the first plant to leave the market in the coal phase-out auction. Unit D never ran.
- 05
Gas steps in: The gas plant ramps up within minutes when wind and sun are lacking; in future also with hydrogen.
- 06
Storage and grid: Since 2024 a battery stores power at the old plant; via Uentrop and Lippborg the site remains a grid node, soon also for wind power from Wilhelmshaven.
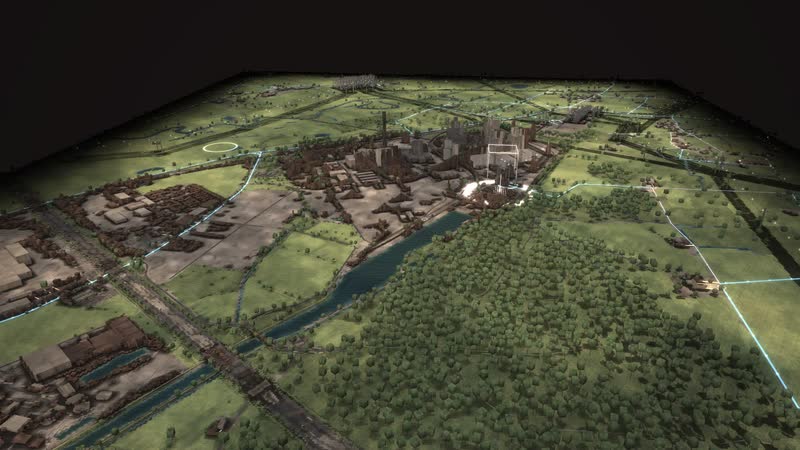
01
Hamm-Uentrop as a model
On the Lippe and the canal, five decades of energy lie in one place: the THTR-300 thorium high-temperature reactor, the Westfalen hard-coal plant, a gas plant and, since 2024, a large battery.
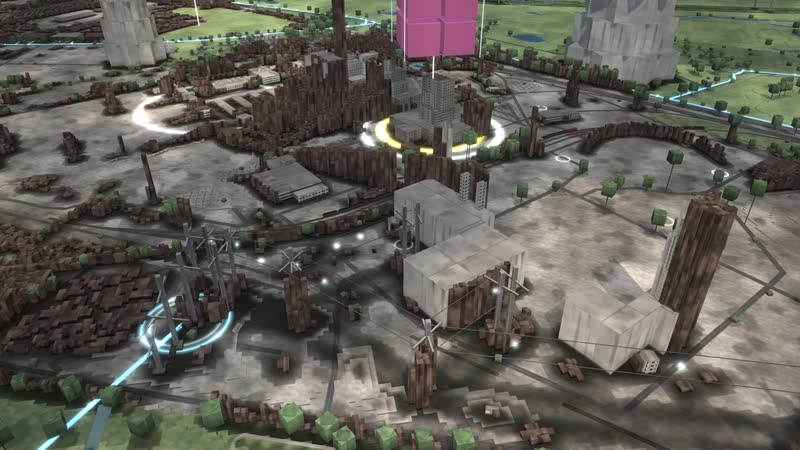
02
The chain of the place
Thorium reactor: Graphite pebbles with thorium and uranium, cooled with helium: on the grid in 1985, shut down in 1988 after 423 full-load days, safely enclosed since 1997.
What is shown – why – for whom
| What is shown | Why | For whom |
|---|---|---|
| The chain Thorium reactor – Dry cooling – Coal by canal – Briefly online – Gas steps in – Storage and grid | Whytells five decades in six steps | For whomSchools, visitors |
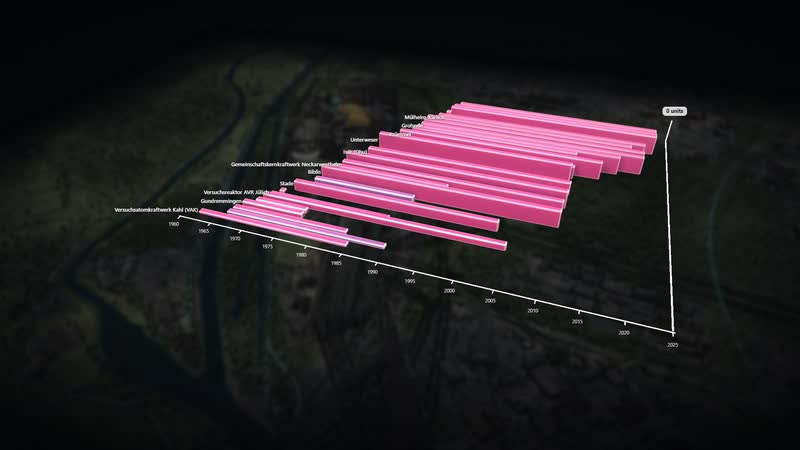
| Diagram ‘The nuclear plants’ | Whyshows every nuclear plant from start-up to shutdown, including the THTR with only three years | For whomMuseums, teaching |
| Diagram ‘Every plant from construction to demolition’ | Whyshows operation, standstill and dismantling of every plant on the site | For whomMunicipalities, communications |
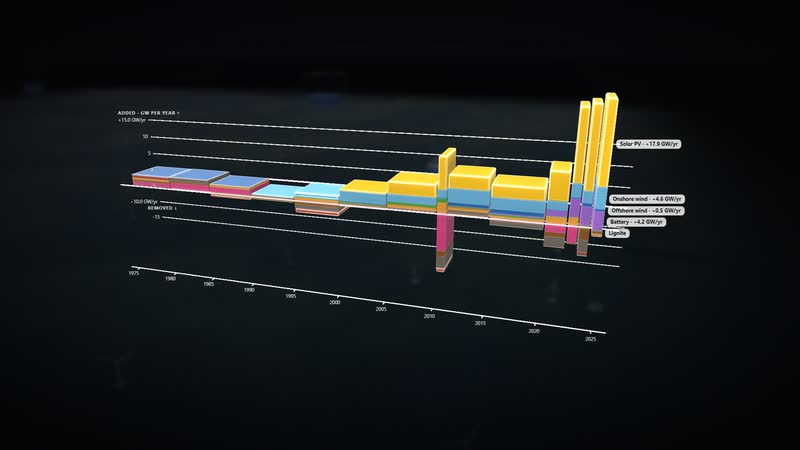
| Diagram ‘Additions and closures’ | Whyshows how much capacity is added and removed each year | For whomPlanning, associations |
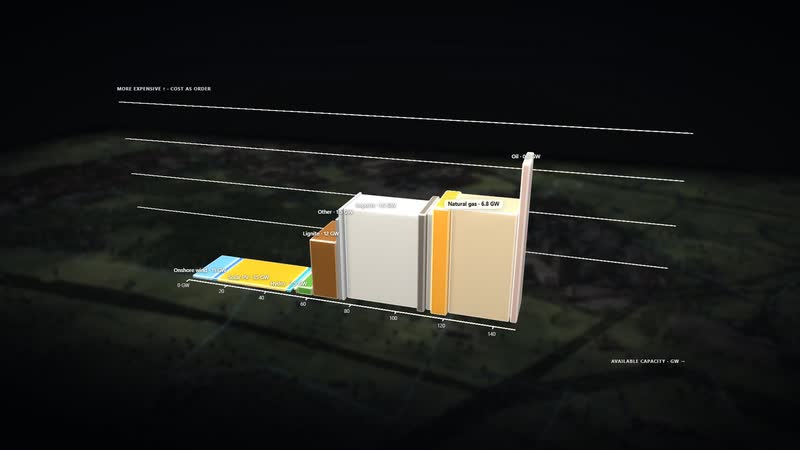
| Diagram ‘Who supplies first’ | Whyshows in which order the plants step in by cost | For whomEnergy industry, universities |
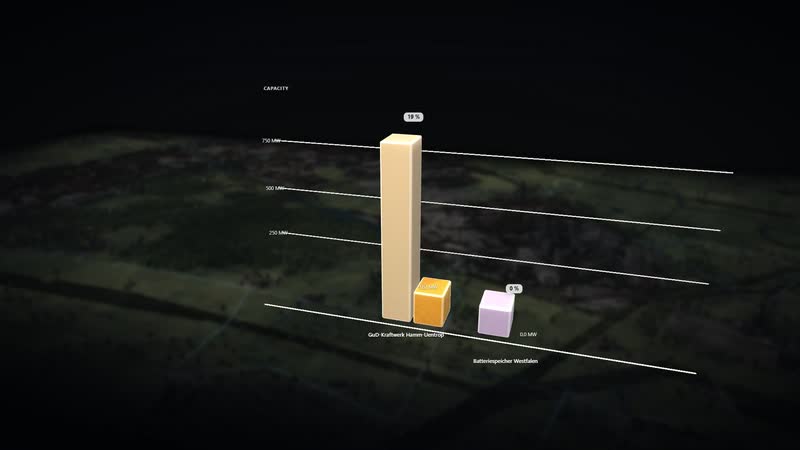
| Switch off: GuD-Kraftwerk Hamm-Uentrop | Whyshows who steps in and how CO₂ and imports change | For whomGrid planning, teaching |
| Lippborg station and the site of the planned Corridor B converter | Whyshow where 2 GW of wind power from the coast is to arrive from about 2030 | For whomMunicipalities, grid planning |
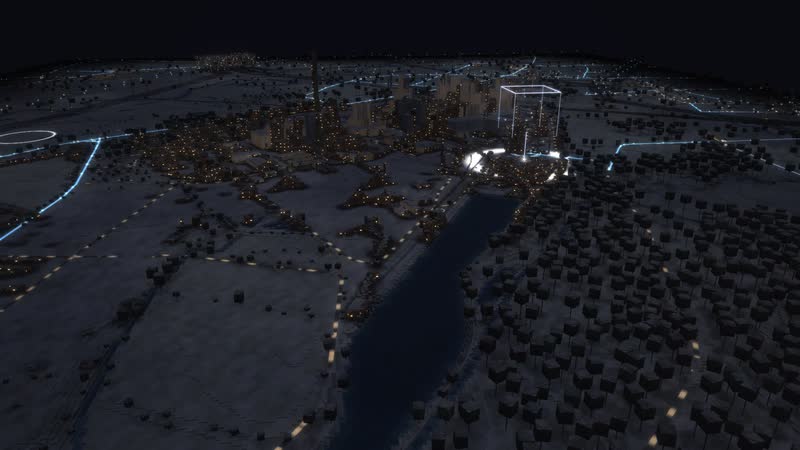
03
Power into every house
In the evening the power flows right into the houses: from the substation via the local stations to every house connection.
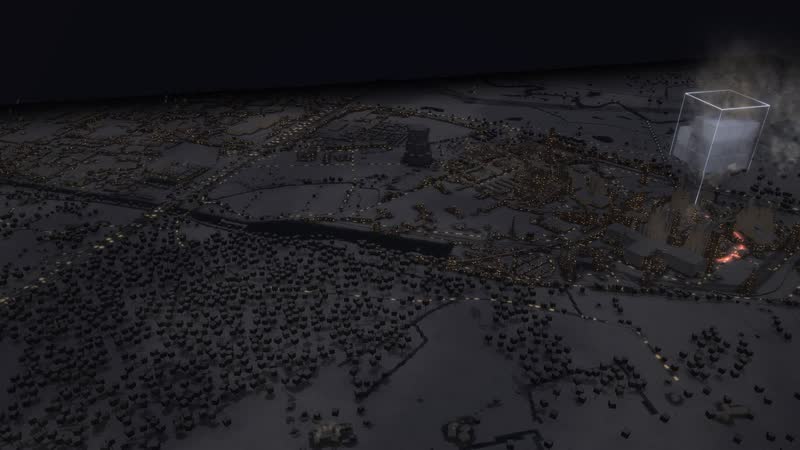
04
Five views, one world
Power, heat, fuels, storage and CO₂ – every view shows its values right at the plants.
Films from the model
-
A day in time-lapse
From morning to midnight: the sun moves, the stacks grow and shrink with wind, sun and demand, at night windows and plants light up.
-
Fifty years in thirty seconds
From 1975 to 2025 in Hamm-Uentrop: plants appear, run, are shut down and dismantled.
-
Five views
Power, heat, fuels, storage and CO₂ – the same world read five different ways, with values right at the plants.
-
Power into every house
Through the place at dusk: from the substation via the local stations to every house connection, with cars and trains.
-
Six diagrams
Calculated live from the model and lit like a film: ‘Capacity of this place 1975–2025’, ‘Every plant from construction to demolition’, ‘Every plant now’, ‘The nuclear plants’, ‘Additions and closures’, ‘Who supplies first’.
-
Using the software
With the full interface: steps of the place, choosing a plant, tiles, CO₂ view, the place’s diagram, time travel.
Facilities and areas in the model
-
THTR-300
Thorium high-temperature reactor with 296 MW net: fuel in graphite pebbles, cooled with helium. Built from 1971, first power on 16 November 1985, shut down on 29 September 1988 after only 423 full-load days.
-
Trockenkühlturm des THTR
A cooling tower made of a cable net by Jörg Schlaich: 141 m wide, the net 147 m high, the mast 181 m. It cooled with air instead of water, without a plume. Demolished on 10 September 1991.
-
Kraftwerk Westfalen A–C
Units A and B with 152 MW each since 1963 (initially also for oil), unit C with 284 MW since 1969. A and B went offline in 2011, C in March 2015.
-
Kühlturm Block C
Wet cooling tower of unit C, 122 m high, demolished on 30 September 2021. Position estimated.
-
Kraftwerk Westfalen D und E
Two new 800 MW units, built from summer 2008; the flue gas leaves through the two 167 m cooling towers. Unit D was damaged by hydrochloric acid in 2013 and never ran.
-
GuD-Kraftwerk Hamm-Uentrop
Combined-cycle gas turbines of an alliance of many municipal utilities: two units of 425 MW each, 57.7 % efficiency, built from 2005, in operation since January 2008. It ramps up quickly when wind and sun are lacking; a third unit for hydrogen is planned.
-
Batteriespeicher Westfalen
140 MW with 151 MWh since December 2024 on the power plant site, together with Neurath the operator's first large battery. An expansion of about 600 MW is under construction until 2028.
-
Netzanschluss Kraftwerk Westfalen 380 kV
This is where unit E's power entered the extra-high-voltage grid; today the battery and the phase shifter connect here.
-
Station Lippborg
Transmission substation. From about 2030 the Corridor B direct-current line from Wilhelmshaven is to arrive here: 2 GW of wind power from the coast.
-
Umspannanlage Uentrop
380 kV: one of the large grid nodes of Westphalia, where lines from all directions meet.
-
Konverter Korridor B (geplant)
On this site north of the plant the converter for Corridor B is planned: direct current from Wilhelmshaven becomes alternating current here, expected from 2030. Position approximate.
05
Fifty years in one place
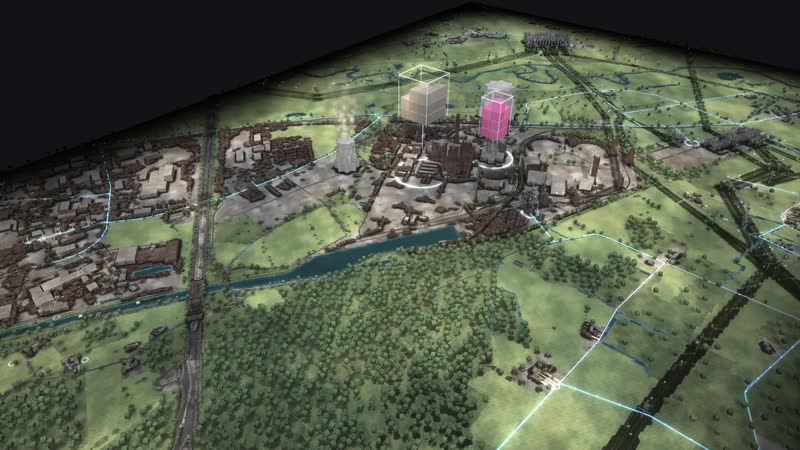
The THTR only ran from 1985 to 1988; its cable-net cooling tower cooled with air and was demolished in 1991.
06
Every plant with its value
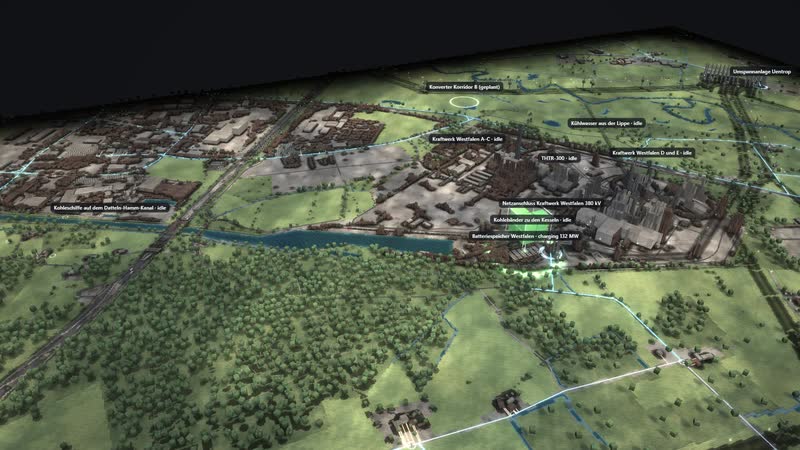
Every plant with its name and its output now in MW.
Processes in the model
The chain of the place
- 01Thorium reactor: Graphite pebbles with thorium and uranium, cooled with helium: on the grid in 1985, shut down in 1988 after 423 full-load days, safely enclosed since 1997.
- 02Dry cooling: The cable-net cooling tower cooled with air instead of water, without a plume; it was demolished in 1991.
- 03Coal by canal: Ships brought the coal along the Datteln-Hamm Canal right up to the plant, belts carried it to the boilers.
- 04Briefly online: Unit E only ran from 2014 to 2020: it was the first plant to leave the market in the coal phase-out auction. Unit D never ran.
- 05Gas steps in: The gas plant ramps up within minutes when wind and sun are lacking; in future also with hydrogen.
- 06Storage and grid: Since 2024 a battery stores power at the old plant; via Uentrop and Lippborg the site remains a grid node, soon also for wind power from Wilhelmshaven.
One day
- 01“Play the day”
- 02the sun moves, wind and demand change every hour
- 03the stacks above the plants grow and shrink
- 04storage charges and discharges
Fifty years
- 01▶ at the year (time travel)
- 021975
- 031987
- 042016
- 052025
- 06plants appear, run, are shut down and dismantled; the history of the place jumps to every year
Intervene
- 01tap GuD-Kraftwerk Hamm-Uentrop
- 02“Switch off”
- 03the top shows who steps in
- 04back with “All on again”
How a power plant and grid site can use the model
-
Operations and grid
Gas plant, battery, phase shifter and 380 kV grid connection in one place: the model shows how a coal site becomes a node for storage and grid.
For whomOperators, grid and storage planning
-
Municipality and region
What comes after coal and the reactor? A battery since 2024, an expansion of about 600 MW by 2028, the Corridor B converter from about 2030 – the history of the place puts it in order.
For whomMunicipalities, economic development, chambers and associations
-
Schools and universities
What was the THTR-300, what is a converter for direct-current lines? The six steps from the thorium reactor to storage and grid fly to each part, and it lights up.
For whomTeachers, energy engineering students
-
Museums and industrial heritage
A cooling tower made of a cable net, 141 m wide, the net 147 m high, the mast 181 m: the model shows structures that no longer exist, and the diagram ‘The nuclear plants’ places the THTR in context.
For whomMuseums, industrial heritage, exhibitions
-
Public communication
Why did unit E only run for six years? The diagram ‘Every plant from construction to demolition’ shows operation, standstill and dismantling of every plant on the site – five decades on one timeline.
For whomPublic relations, policymakers, associations
07
Diagrams of the place
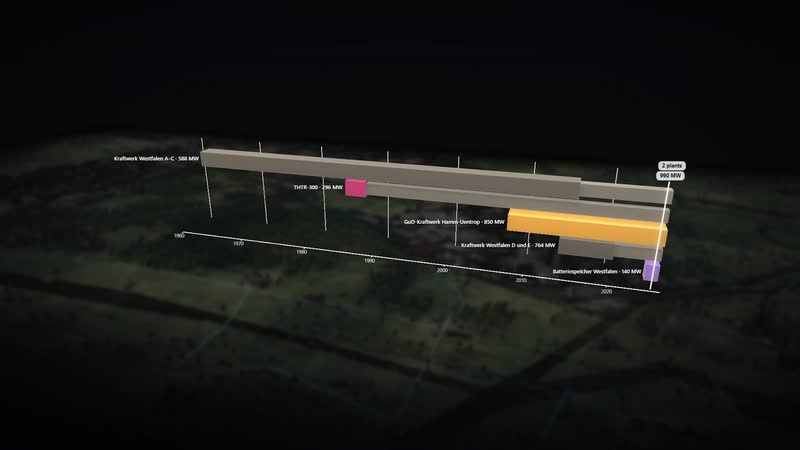
Every plant of Hamm-Uentrop from construction to demolition – one of three diagrams calculated only from this place’s data.
08
The whole software
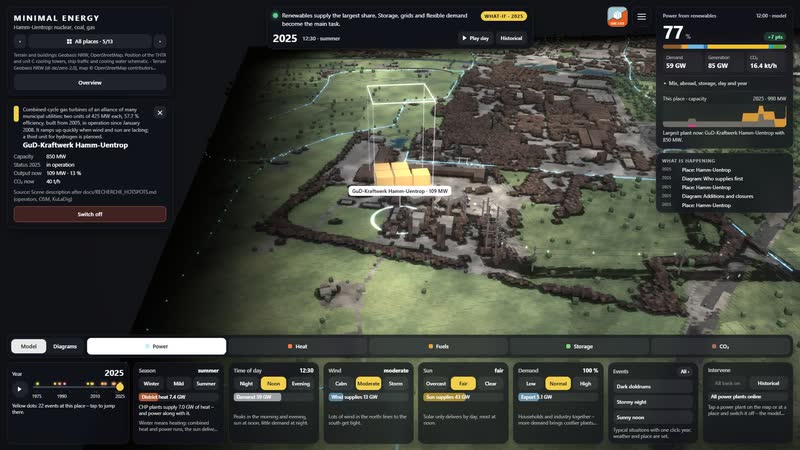
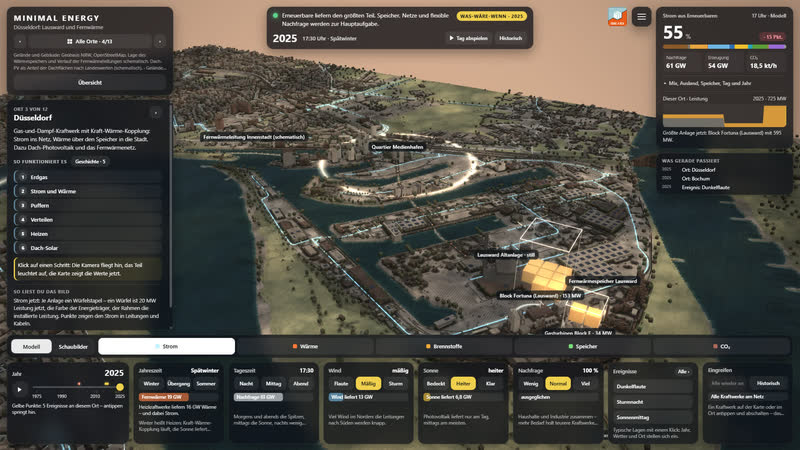
Place selection, situation, info card, steps, views, year and tiles: one click on a plant shows capacity, years and the value now.
What you can change
Controls
- Year 1975–2025: plants appear and disappear, mix and grid change; ▶ lets the years run.
- Season: snow, foliage, meadows, chimney smoke; more heat and power demand in winter, more sun in summer.
- Time of day: sun position, dusk, night with windows and street lights; demand follows the daily profile.
- Wind: rotors turn faster, sea state, smoke plumes lie flat; wind power rises, curtailment in a storm.
- Sun: clouds and soft shadows; photovoltaics deliver more or less.
- Demand (households, industry): more lit windows, plant lighting, chimney smoke; more expensive plants step in.
- Views: power, heat, fuels, storage, CO₂ – each with its own columns, stacks and values.
Events
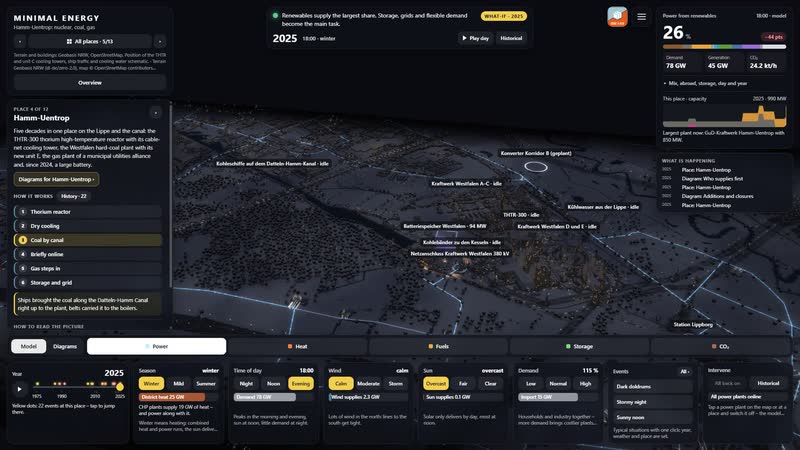
- Winter evening without wind or sun (tiles): Season winter, evening, calm, overcast: demand peaks, the stacks above wind and solar shrink, fossil plants, storage and imports carry the load.
- Stormy night (tiles): Night, gale, low demand: wind delivers more than is needed, storage charges, surplus is curtailed or exported.
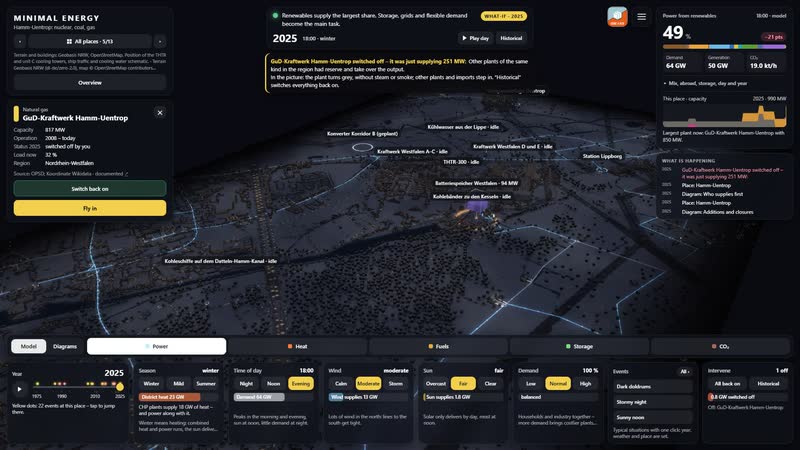
- Switch off: GuD-Kraftwerk Hamm-Uentrop: The model calculates without this plant; the top shows who steps in, CO₂ and imports change.
What the model gives a power plant and grid site
-
01
Five decades in one place
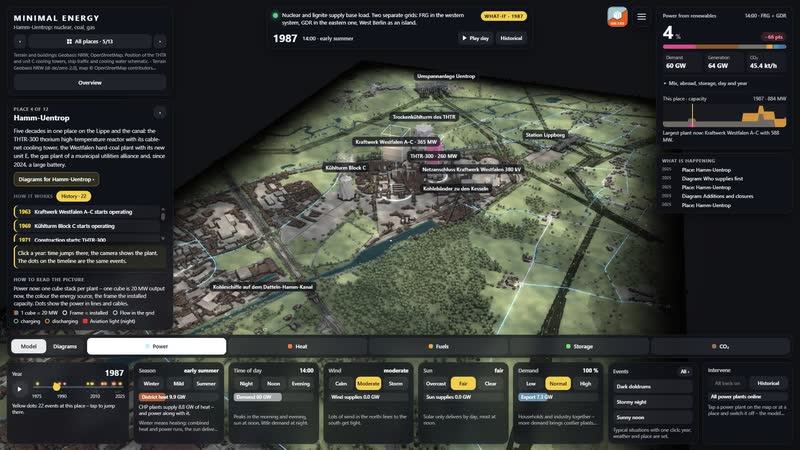
Reactor, coal, gas, battery and grid side by side; time travel shows 1975, 1987, 2016 and 2025 from the same camera.
-
02
What has vanished stands again
The THTR’s cable-net cooling tower and the unit C cooling tower, both demolished, stand in the model in their years.
-
03
Switch off yourself
Tap GuD-Kraftwerk Hamm-Uentrop, ‘Switch off’: the model calculates without the plant and the top shows who steps in. ‘All on again’ takes you back.
-
04
The grid node made visible
Uentrop, Lippborg and the 380 kV grid connection show why the site stays important without coal: lines from all directions meet here.
-
05
In the browser and on the big screen
A browser is enough, and large projections work too. Eleven more places and the map of Germany are part of the same model, designed by an artist and developer.
-
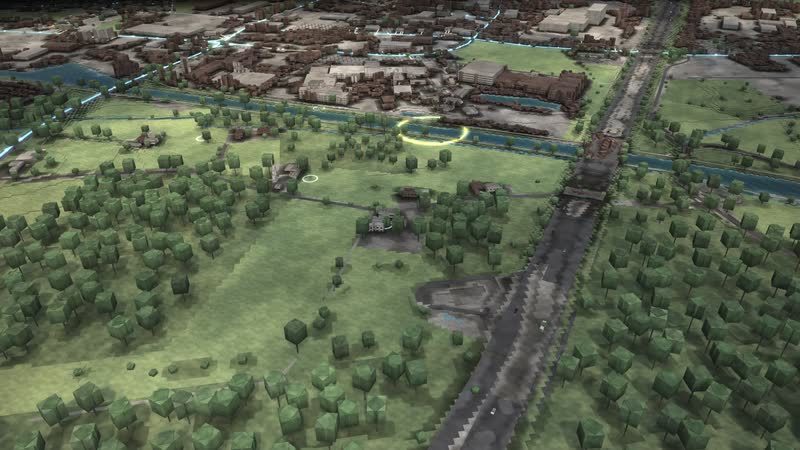
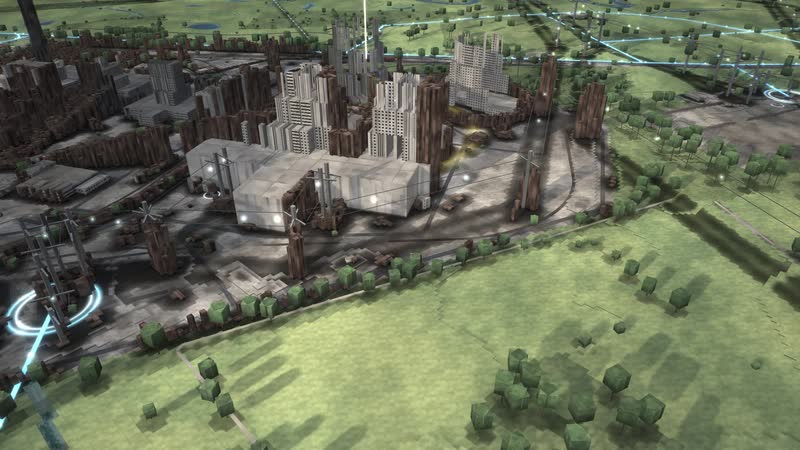
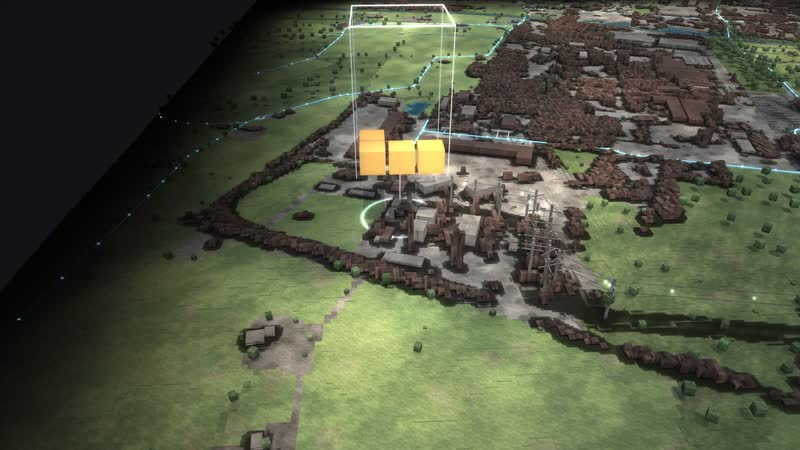
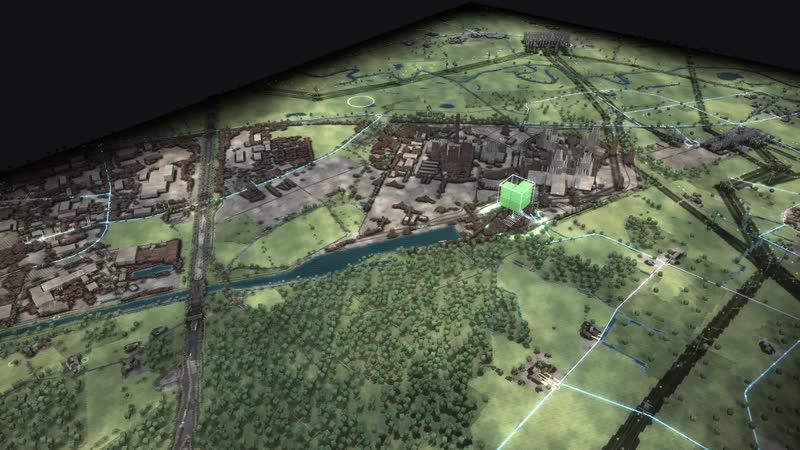
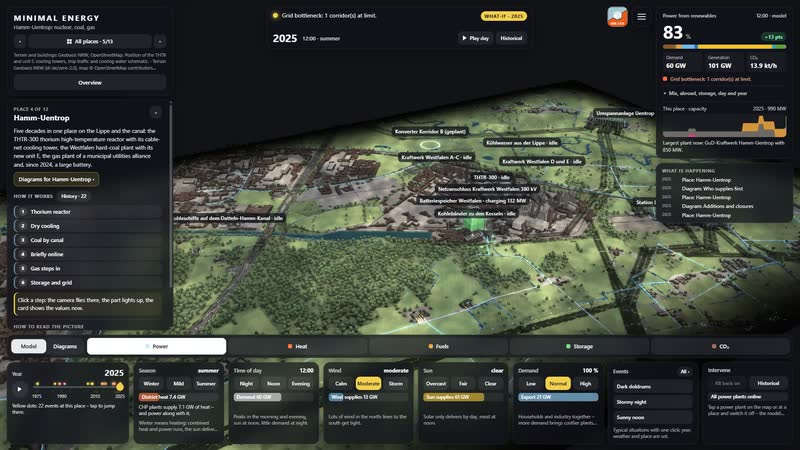
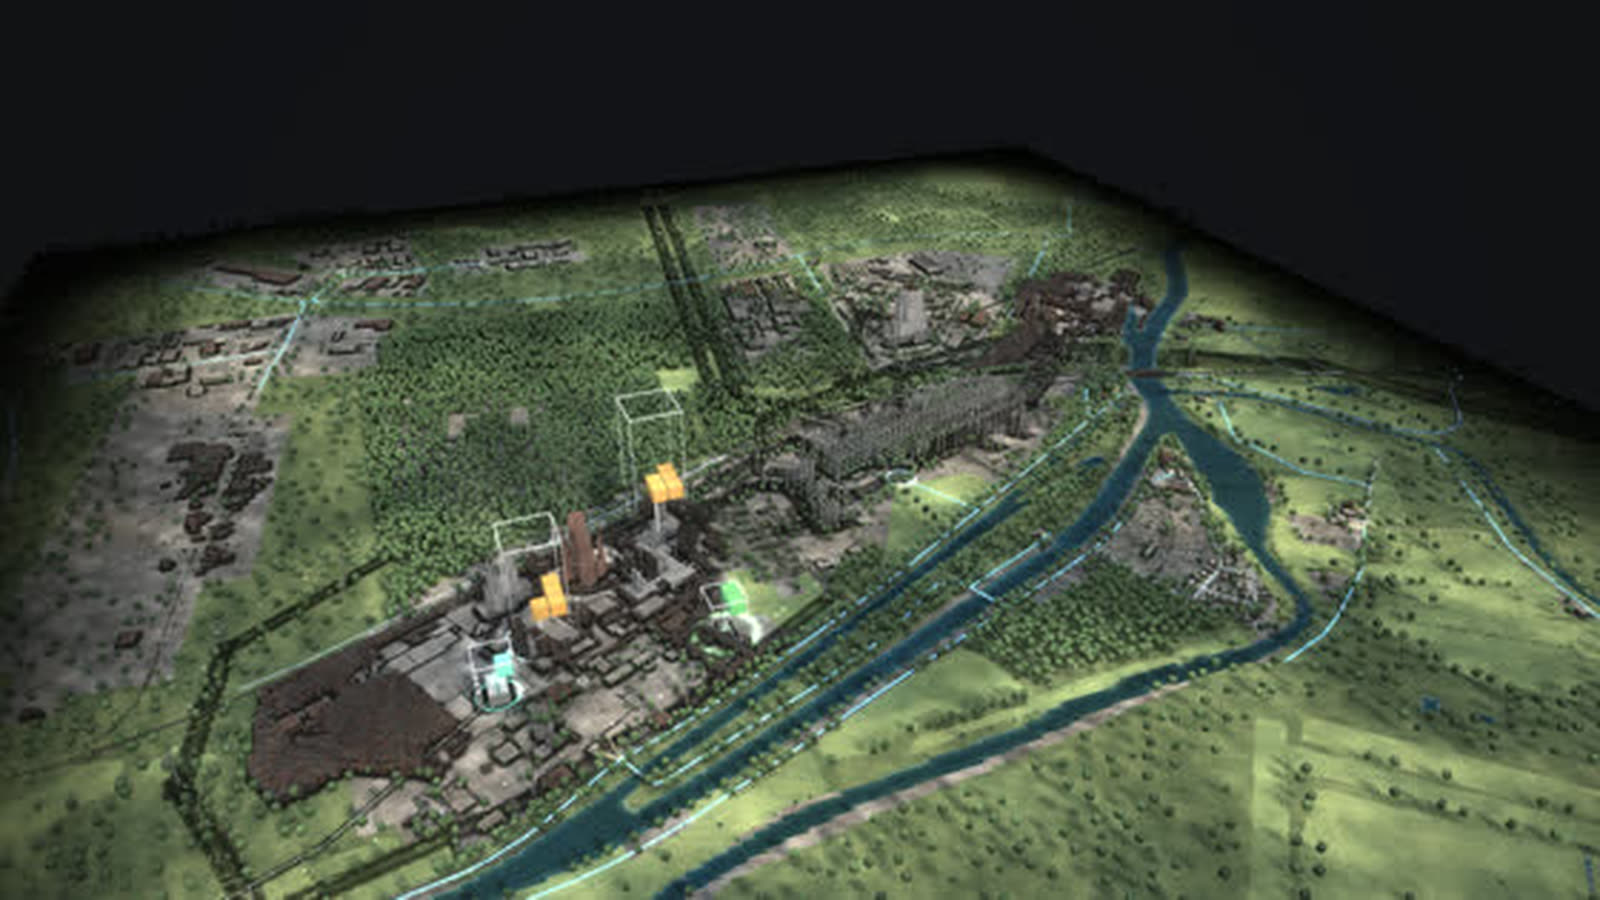
Hamm-Uentrop in the morning – Five decades in one place on the Lippe and the canal: the THTR-300 thorium high-temperature reactor with its cable-net cooling tower, the Westfalen hard-coal plant with its new unit E, the gas plant… -
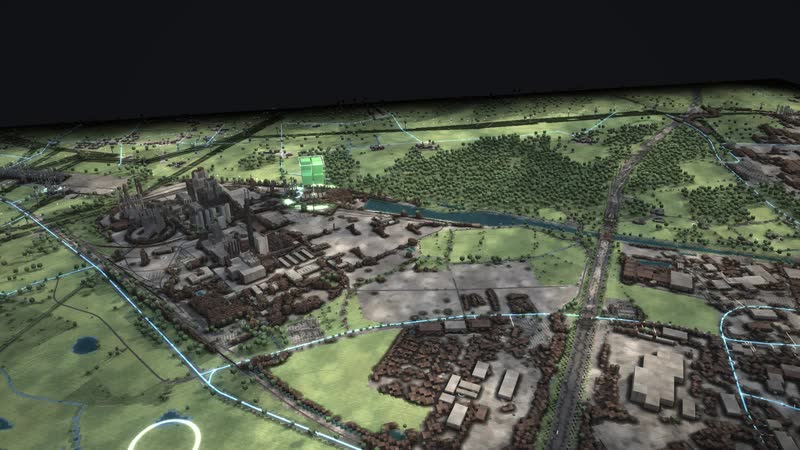
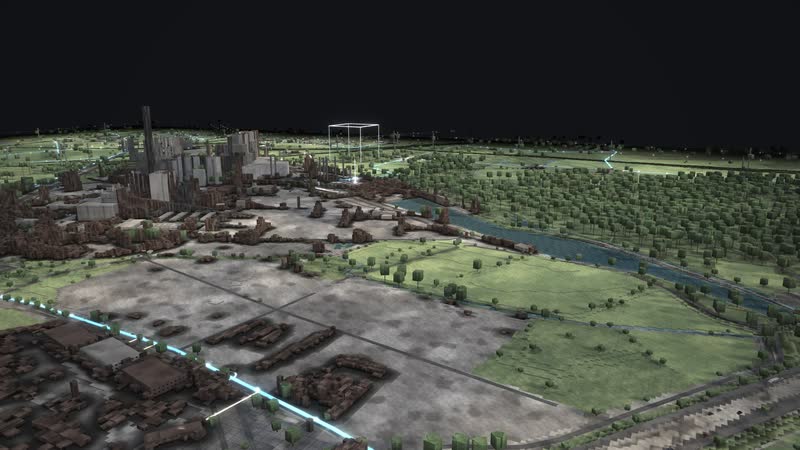
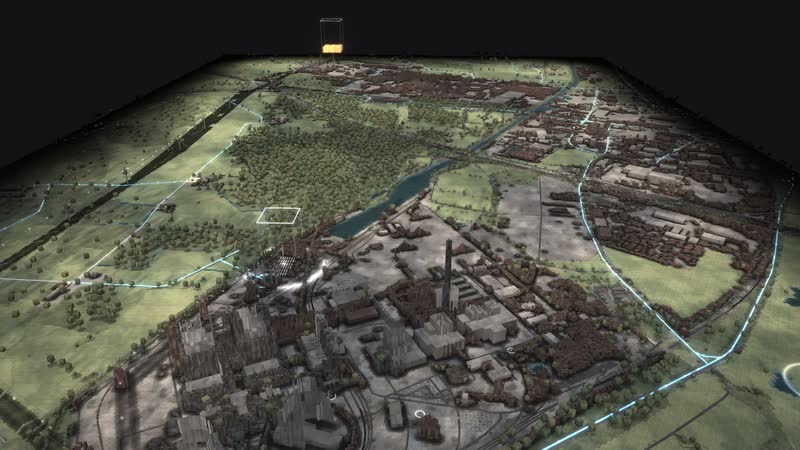
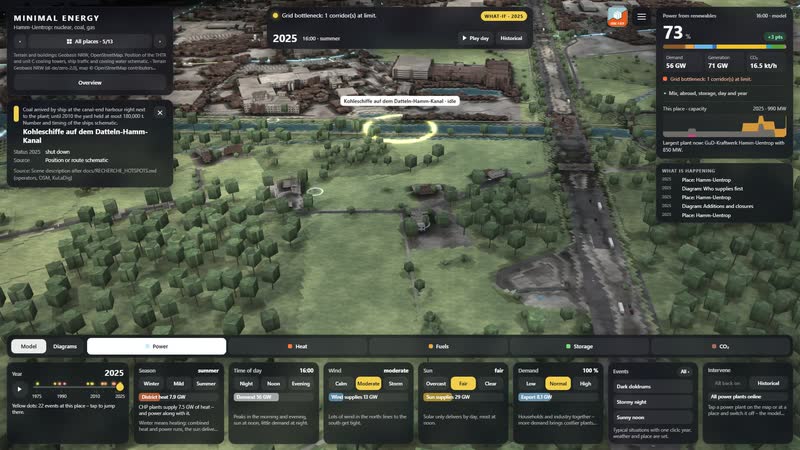
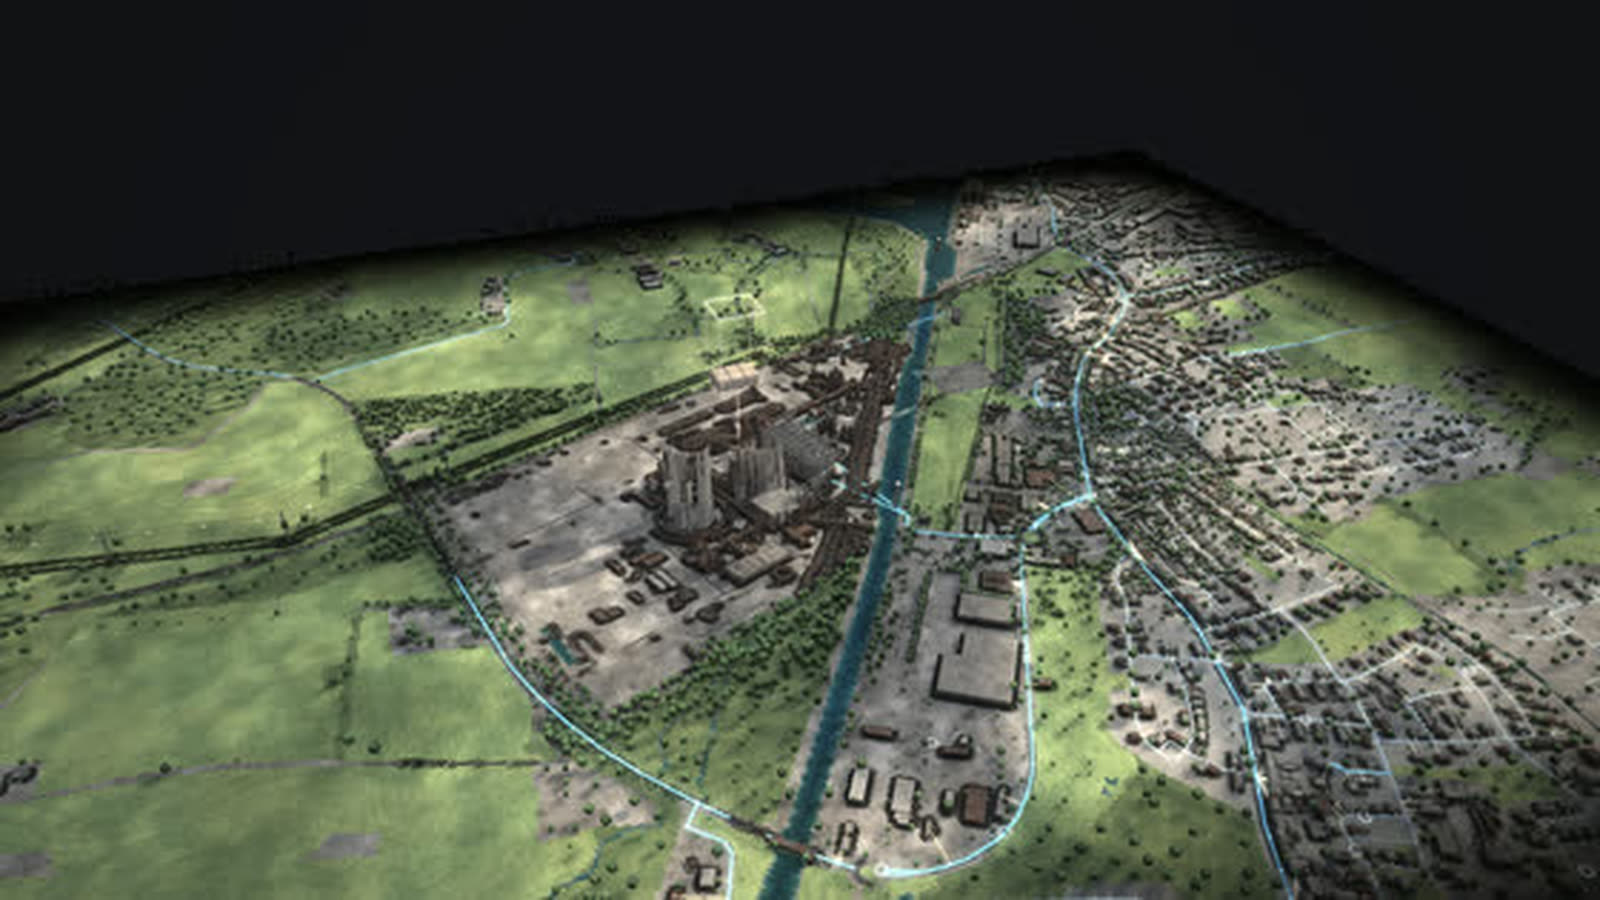
Hamm-Uentrop from the opposite side in afternoon light. -
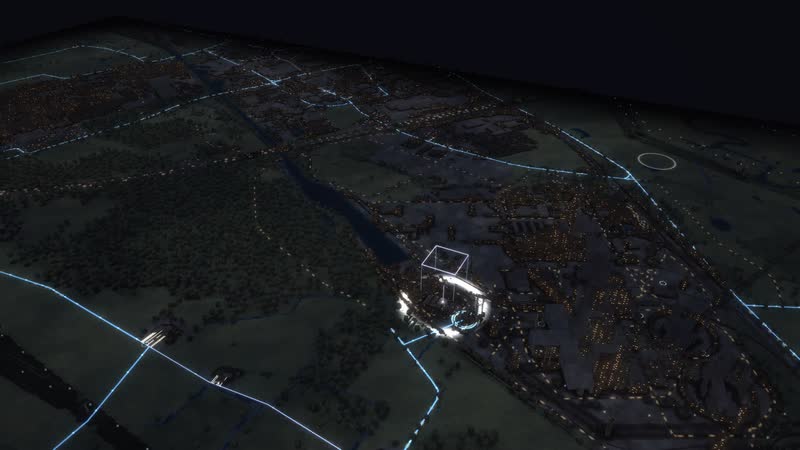
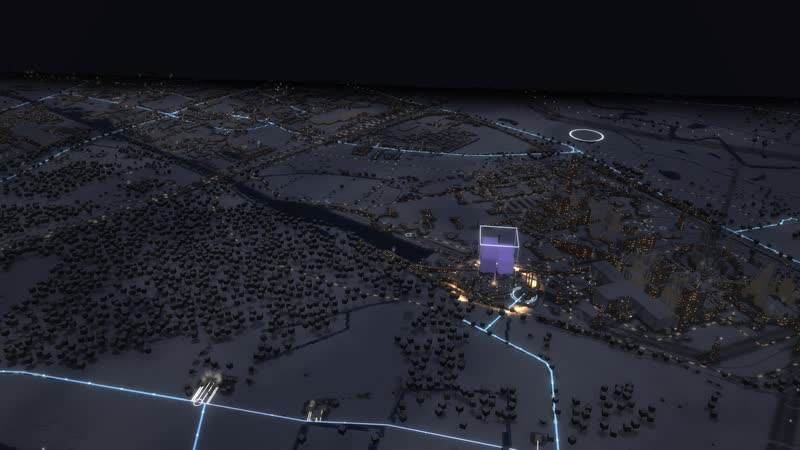
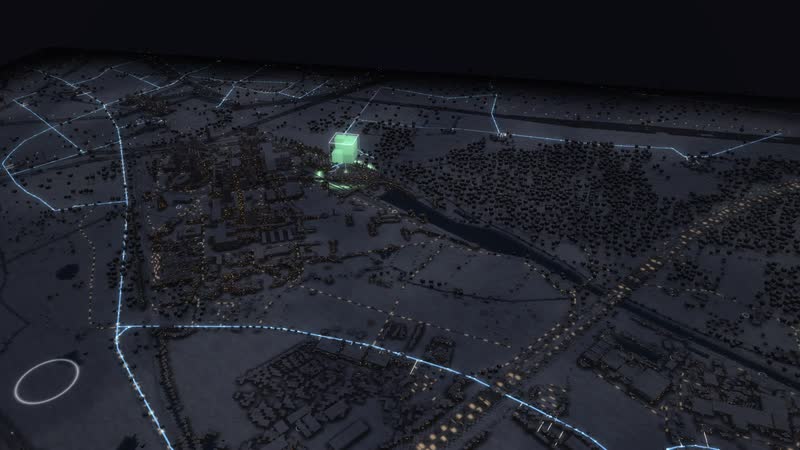
Hamm-Uentrop in the evening – low sun, the first lights, the cube stacks show the power now. -
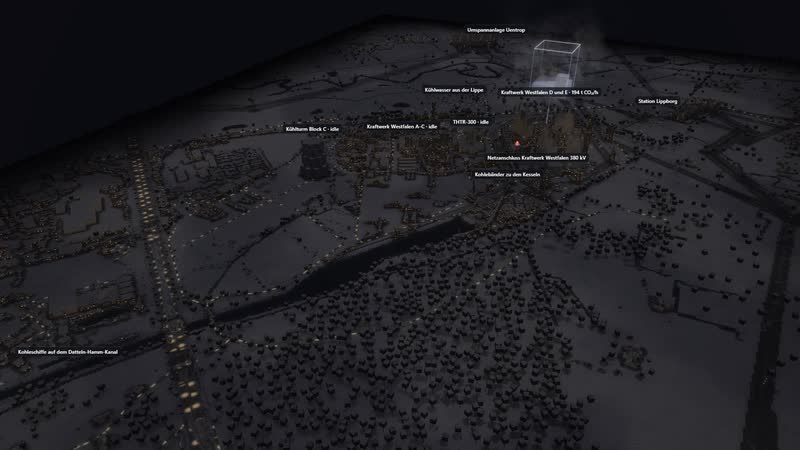
Night – windows, street lights and plant lighting, the stacks glow above the plants. -
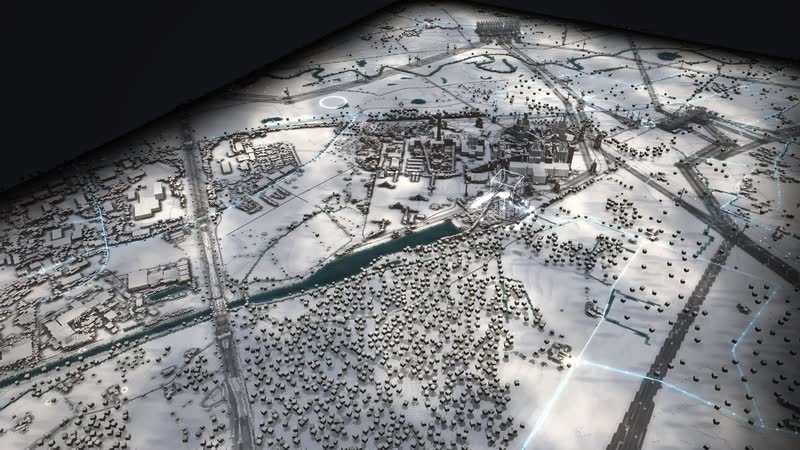
Winter morning – snow on the roofs, chimney smoke above the houses, demand rises. -
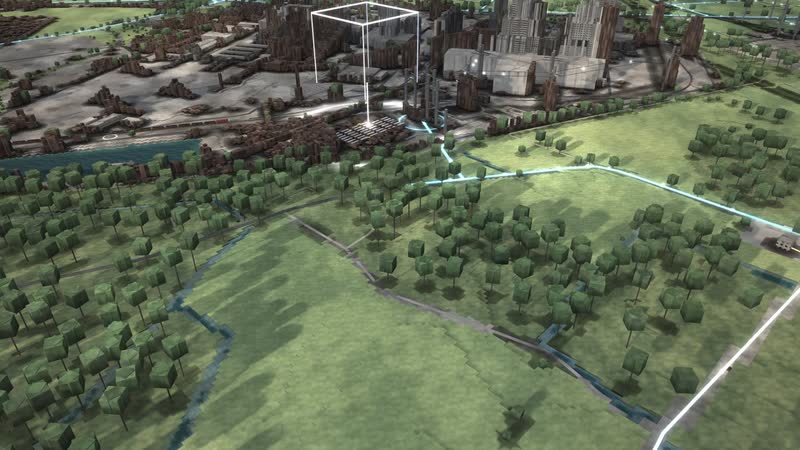
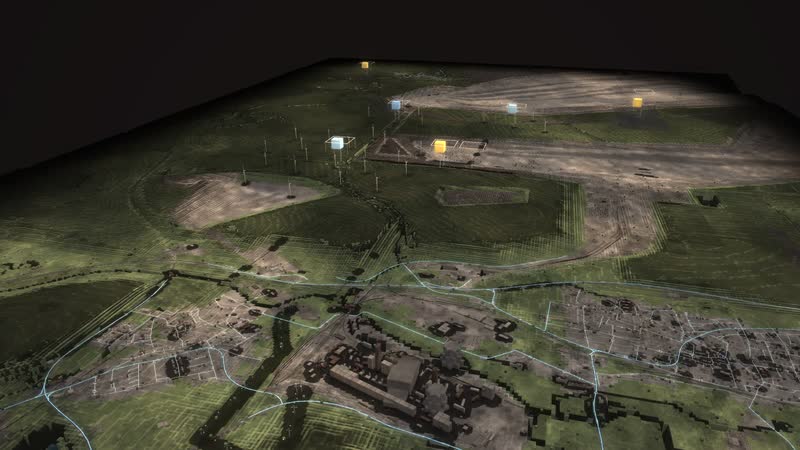
Hamm-Uentrop from high above – the whole place with terrain, routes and plants. -
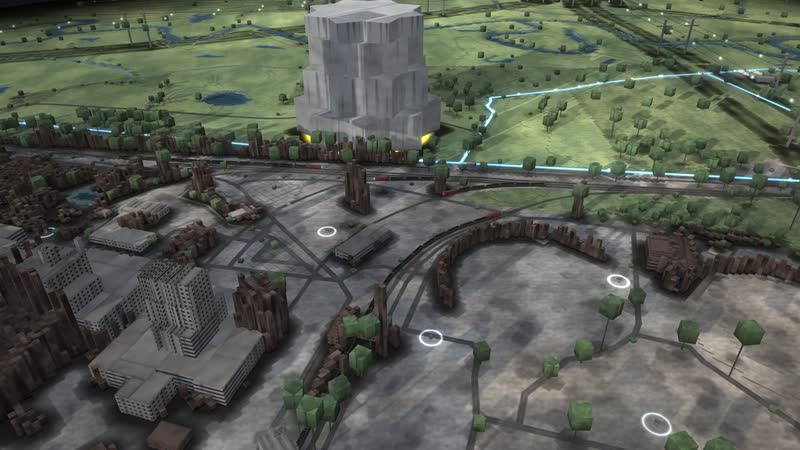
At eye level – cars, lorries and trains on the routes from OpenStreetMap. -
Early morning between winter and summer, the sun still low. -
Thorium reactor: Graphite pebbles with thorium and uranium, cooled with helium: on the grid in 1985, shut down in 1988 after 423 full-load days, safely enclosed since 1997. -
Dry cooling: The cable-net cooling tower cooled with air instead of water, without a plume; it was demolished in 1991. -
Coal by canal: Ships brought the coal along the Datteln-Hamm Canal right up to the plant, belts carried it to the boilers. -
Briefly online: Unit E only ran from 2014 to 2020: it was the first plant to leave the market in the coal phase-out auction. Unit D never ran. -
Gas steps in: The gas plant ramps up within minutes when wind and sun are lacking; in future also with hydrogen. -
Storage and grid: Since 2024 a battery stores power at the old plant; via Uentrop and Lippborg the site remains a grid node, soon also for wind power from Wilhelmshaven. -
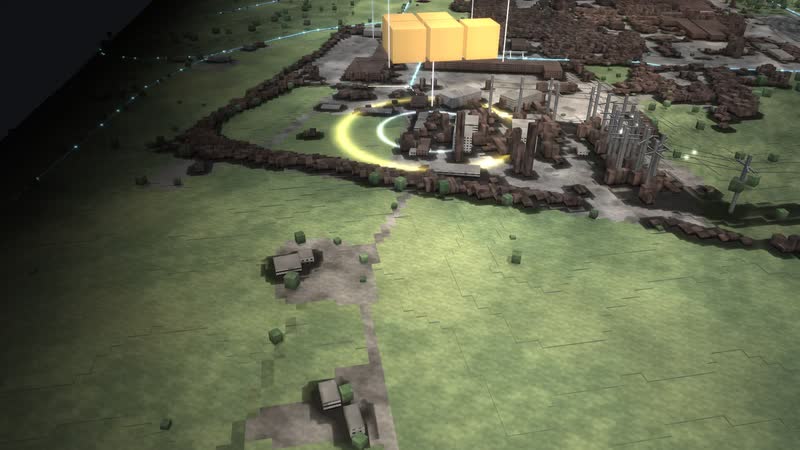
Power now: above GuD-Kraftwerk Hamm-Uentrop stands a stack of cubes – one cube is 20 MW, the frame the installed capacity. -
In the evening the power flows right into the houses: from the substation via the local stations to every house connection. -
Dark doldrums – no wind, no sun: the stacks show what still delivers now. -
Stormy night – wind delivers more than is needed, storage charges. -
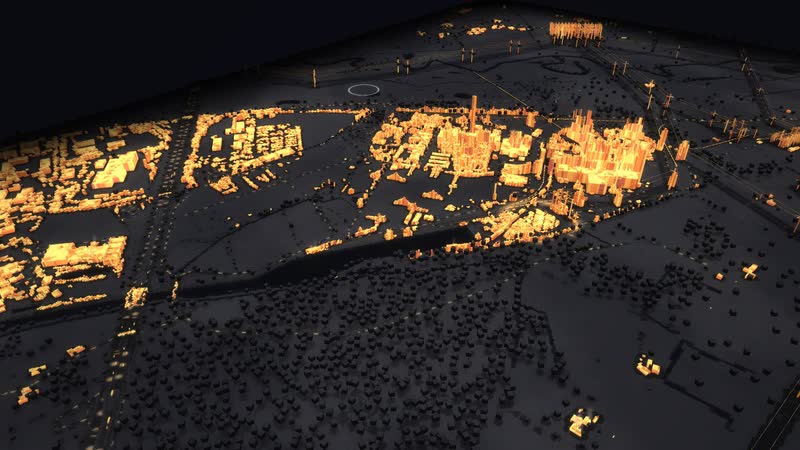
Heat view on a winter evening – houses as a thermal image, columns at plants that supply heat. -
Fuels view – the world turns grey, whatever is delivered and burned glows in its colour. -
Storage view at sunny midday – bars show the fill level, green charges, orange discharges. -
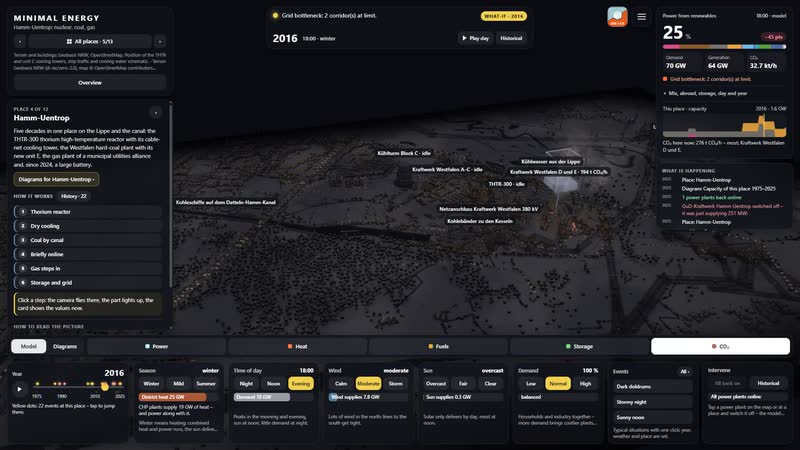
CO₂ view 2016 – one stack per fossil plant, one cube 20 t of CO₂ per hour, green rings without CO₂. -
1975: in operation is Kraftwerk Westfalen A–C. -
1987: new are THTR-300. -
2016: new are Kraftwerk Westfalen D und E, GuD-Kraftwerk Hamm-Uentrop; no longer running THTR-300, Kraftwerk Westfalen A–C. -
2025: new are Batteriespeicher Westfalen; no longer running Kraftwerk Westfalen D und E. -
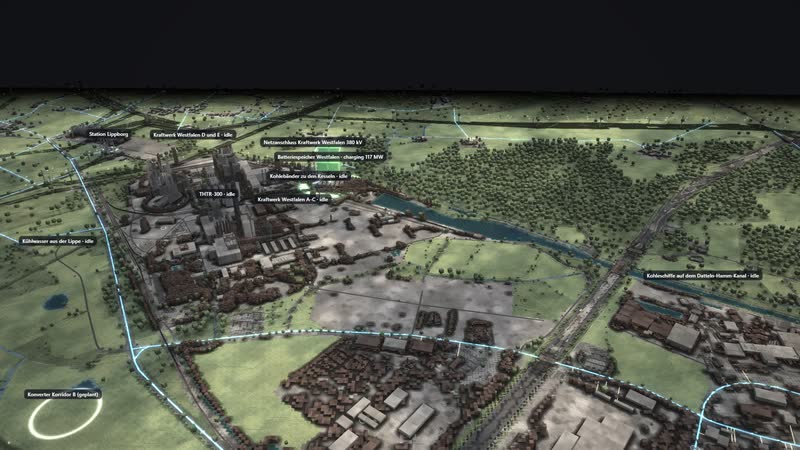
Every plant with its name and its output now in MW. -
2016, CO₂ view: the names carry the emissions now in tonnes per hour. -
What runs, what stands still, what has been removed – every plant names its state. -
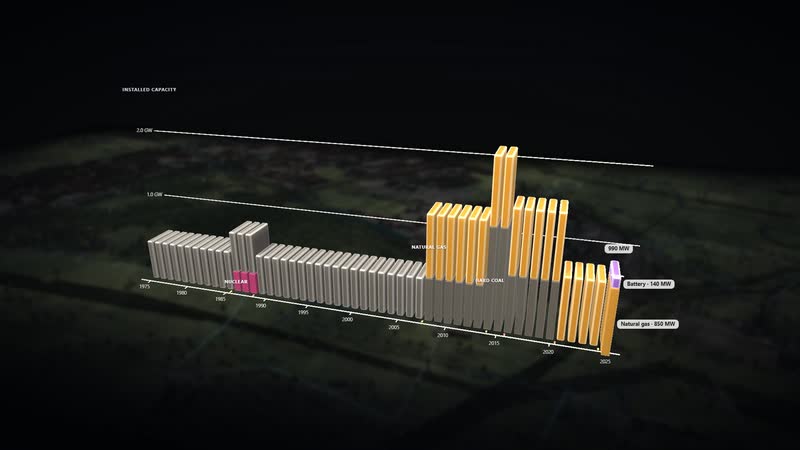
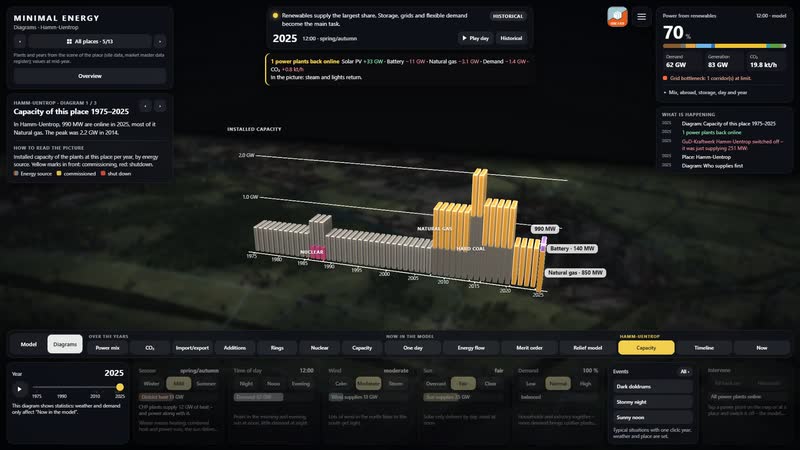
Diagram ‘Capacity of this place 1975–2025’ – the installed capacity of this place per year by source, from the data of Hamm-Uentrop. -
Diagram ‘Every plant from construction to demolition’ – every plant of this place with operation, standstill and dismantling, from the data of Hamm-Uentrop. -
Diagram ‘Every plant now’ – installed against what each plant delivers in this hour, from the data of Hamm-Uentrop. -
Diagram ‘The nuclear plants’ – every nuclear plant from start-up to shutdown. -
Diagram ‘Additions and closures’ – how much capacity is added and removed each year. -
Diagram ‘Who supplies first’ – in which order the plants step in by cost. -
The whole software – place selection, situation, power from renewables, info card, views, year and tiles. -
GuD-Kraftwerk Hamm-Uentrop selected – the card names capacity, years, state and the value now. -
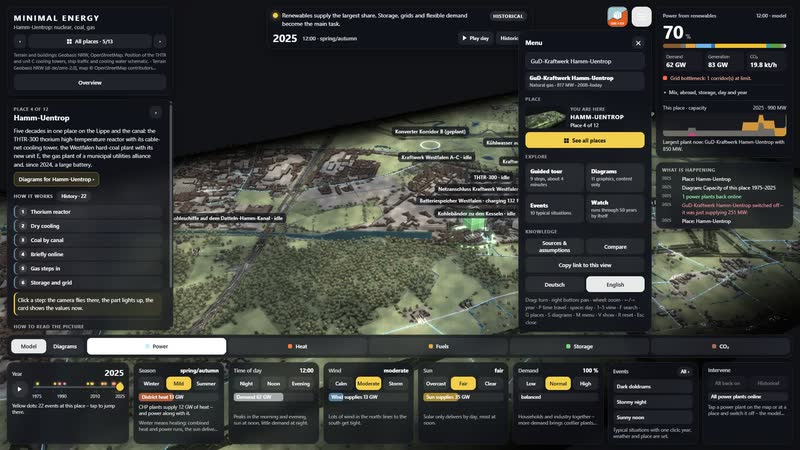
How it works – one click on a step flies there and the part lights up. -
The history of the place – years to tap, the dots on the timeline jump there. -
Winter evening set with the tiles – season, time of day, wind, sun and demand act on the picture at once. -
Intervene yourself – a power plant switched off, the top shows who steps in. -
Diagram ‘Capacity of this place 1975–2025’ with panel and legend. -
CO₂ view – on the right the place card names the emissions now and the plant with the most. -
Search in the menu – places, power plants with capacity and years, diagrams and events. -
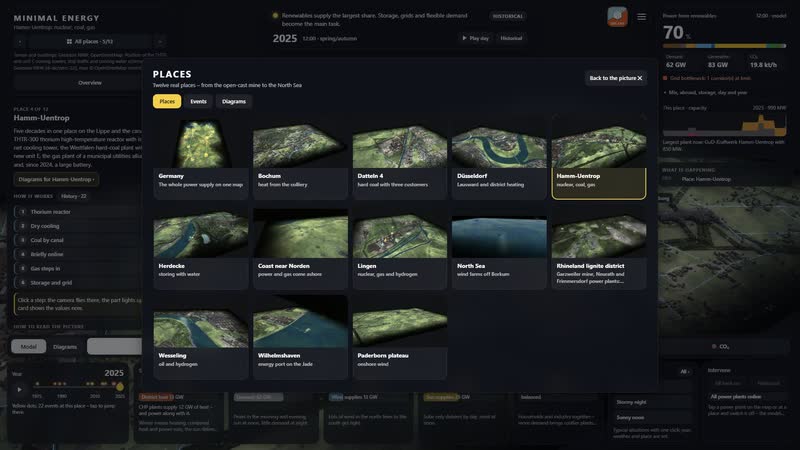
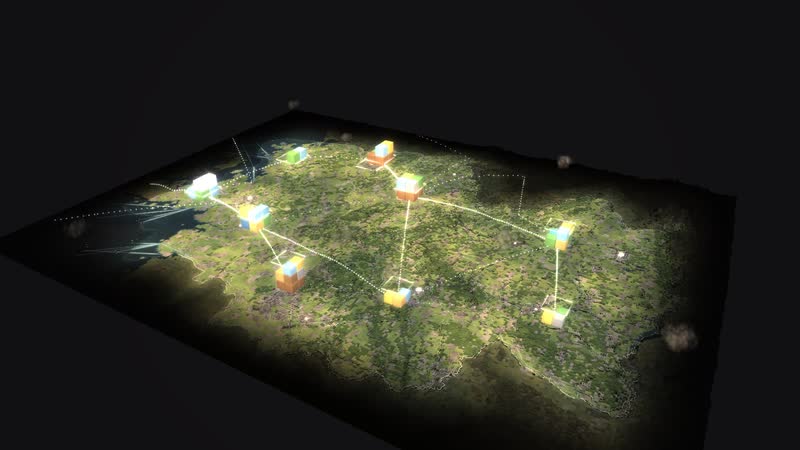
Twelve places and the map of Germany to choose from, each with its own picture.
Your site as a model
Would you like to show your site with power plant, storage and grid connection this way, with real schedules and expansion plans? Write to us or give us a call, and we will discuss which data the model needs. We will send you the password to the simulation on request.
cube4tec.de/spiele/minimal-energy/
Ask about this
Minimal Energy: Hamm-Uentrop
Basis and limits
Real are terrain and buildings (Geobasis NRW, OpenStreetMap) and the plants with capacity and years. The position of the THTR and unit C cooling towers, the ship traffic and the cooling water are schematic; output now and CO₂ come from the model.
Public sources the model is based on:
- Geobasis NRW (dl-de/zero-2.0)
- OpenStreetMap-Mitwirkende (ODbL)
- BASE Stilllegungsliste (07/2026); Netto: Wikipedia (sekundär); Koordinate: Wikidata
- OPSD; Wikipedia: Ausstieg Kohleverstromung (sekundär)
More places in the model
-
Lingen
The whole nuclear era in one place as a walkable model: the Lingen nuclear plant of 1968, the Emsland nuclear plant until April 2023, interim storage and dismantling – next to them gas, a battery and hydrogen.
-
Datteln 4
Germany’s newest hard-coal plant as a walkable model: coal by ship on the Dortmund-Ems Canal, power for the grid and the railway, district heat as far as Recklinghausen.
-
Rhineland lignite district
The Rhineland lignite district as a walkable model: from the Garzweiler mine via conveyors, boilers and cooling towers into the 380 kV grid – while wind, sun and batteries grow on the reclaimed land.
-
Wilhelmshaven
Germany’s only deep-water port as a walkable model: crude oil for the pipeline to the Rhineland, coal for two power plants and, since December 2022, liquefied natural gas from Germany’s first LNG terminal.
-
Herdecke
Three generations of storage at Lake Hengstey as a walkable model: the Koepchenwerk of 1930, the pumped-storage plant of 1989 and batteries since 2017 – the level in the reservoir follows sun, wind and demand.
-
Germany 1975–2025
Fifty years of energy supply on one map: 365 sites, ten grid regions and the power of every hour – from two separate grids in 1975 to wind and sun in 2025.
-
Düsseldorf Lausward
A combined-cycle gas plant on the Rhine as a walkable model: power to the grid, heat via a 58 m storage tank and the district heating line into the media harbour and the city centre.
-
Paderborn plateau
One of the densest wind landscapes in North Rhine-Westphalia as a walkable model: every turbine with its year, from the 500 kW turbine of 1995 to the 6.2 MW turbine with a 169 m hub.
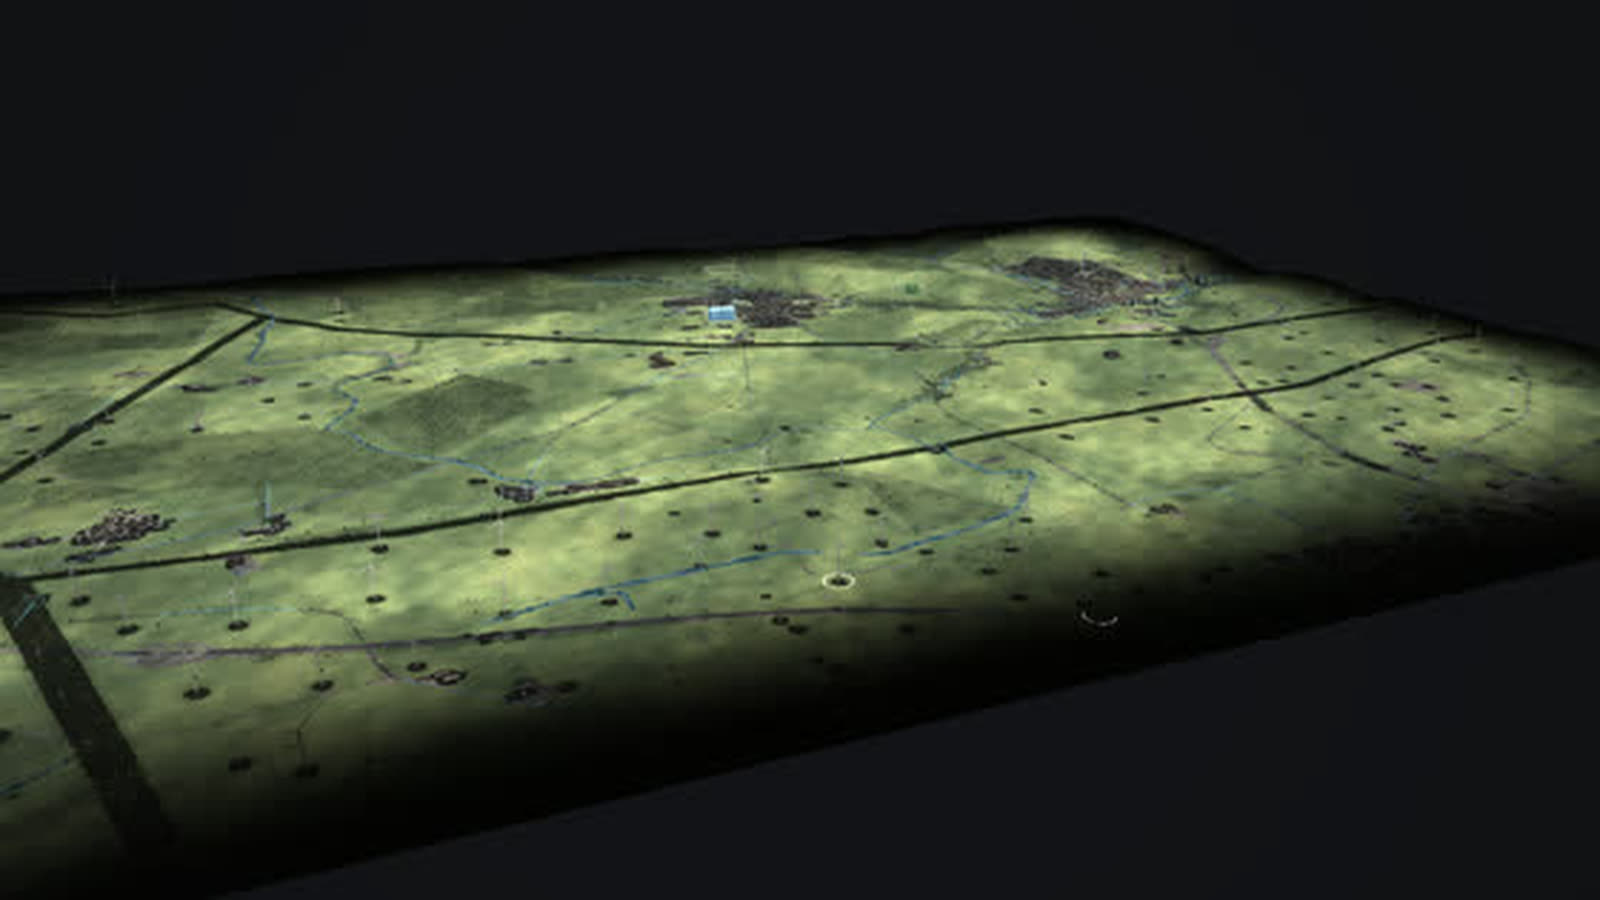
Real are terrain and buildings (Geobasis NRW, OpenStreetMap) and the plants with capacity and years. The position of the THTR and unit C cooling towers, the ship traffic and the cooling water are schematic, and the site of the planned converter is approximate; output now and CO₂ come from the model…