Simulation · Minimal Energy · Wind and sea
North Sea off Borkum
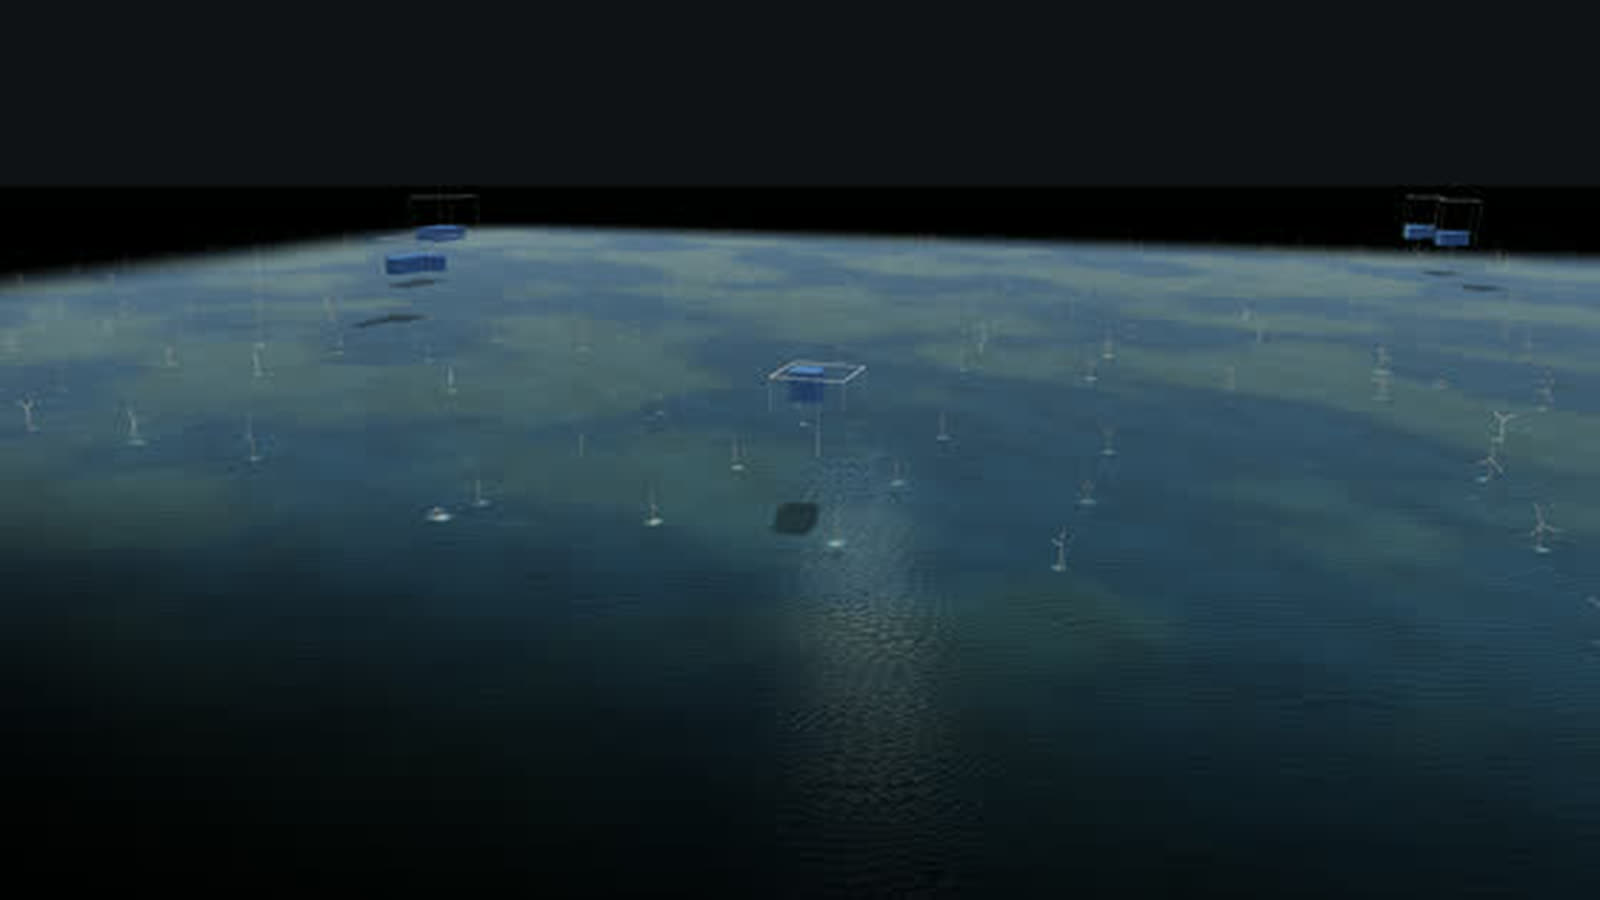
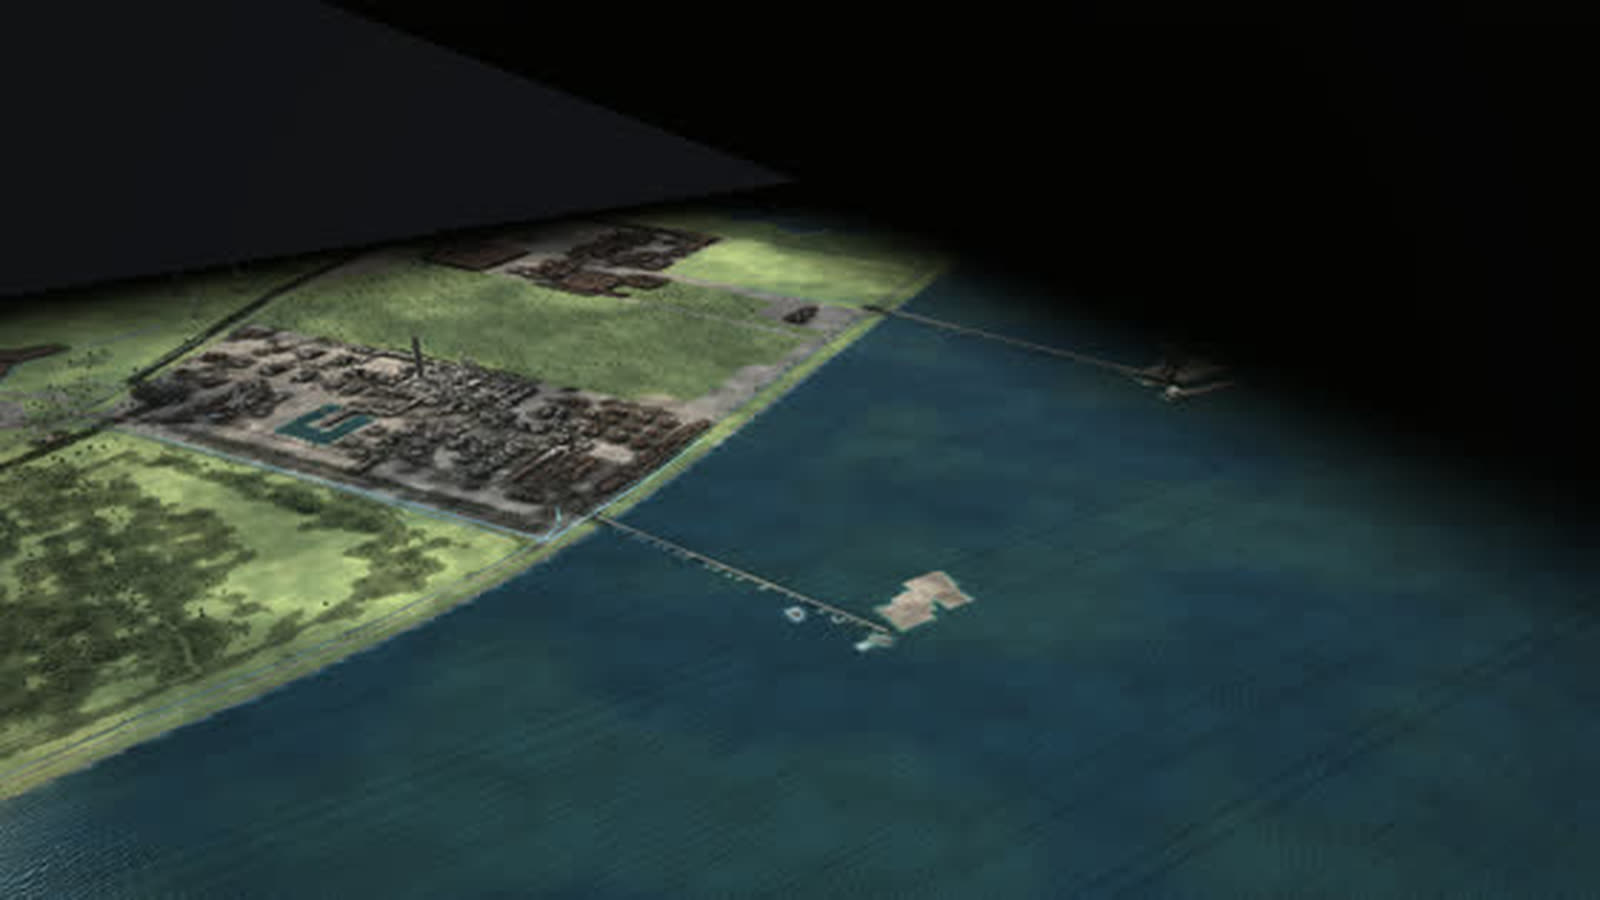
The beginning of German offshore wind as a walkable model: twelve test turbines from 2009, a cluster of 284 turbines and about 1,660 MW, substation and converter platforms and the way ashore.
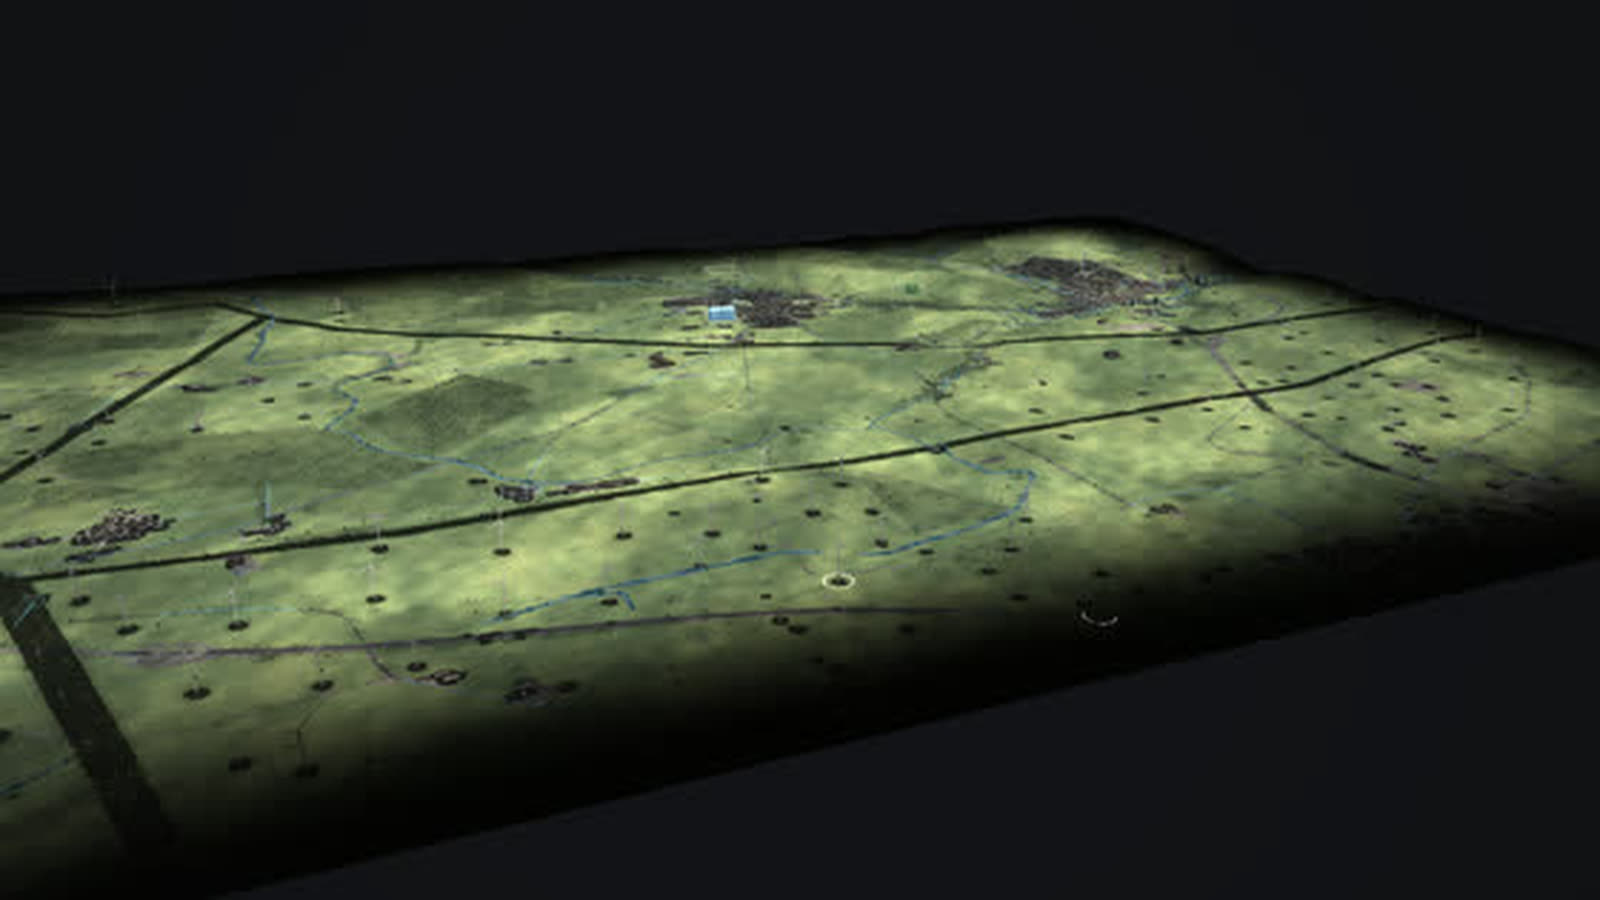
Real are every turbine with its year from the market master data register, platforms and cable routes (OpenStreetMap) and the capacities as stated by the grid operator. The sea has no elevation data, ship traffic is schematic; what the wind farms deliver now comes from the model. With your data it shows more, such as real yields per wind farm, availability or supply vessel trips.
Offshore wind off Borkum: about 45 km north of the island, German offshore wind began in 2009 with the twelve test turbines of alpha ventus – 5 MW each in about 30 m of water, the first kilowatt hour in August 2009. By 2020 a cluster of 284 turbines and about 1,660 MW grew next to it, each turbine with its year from the market master data register.
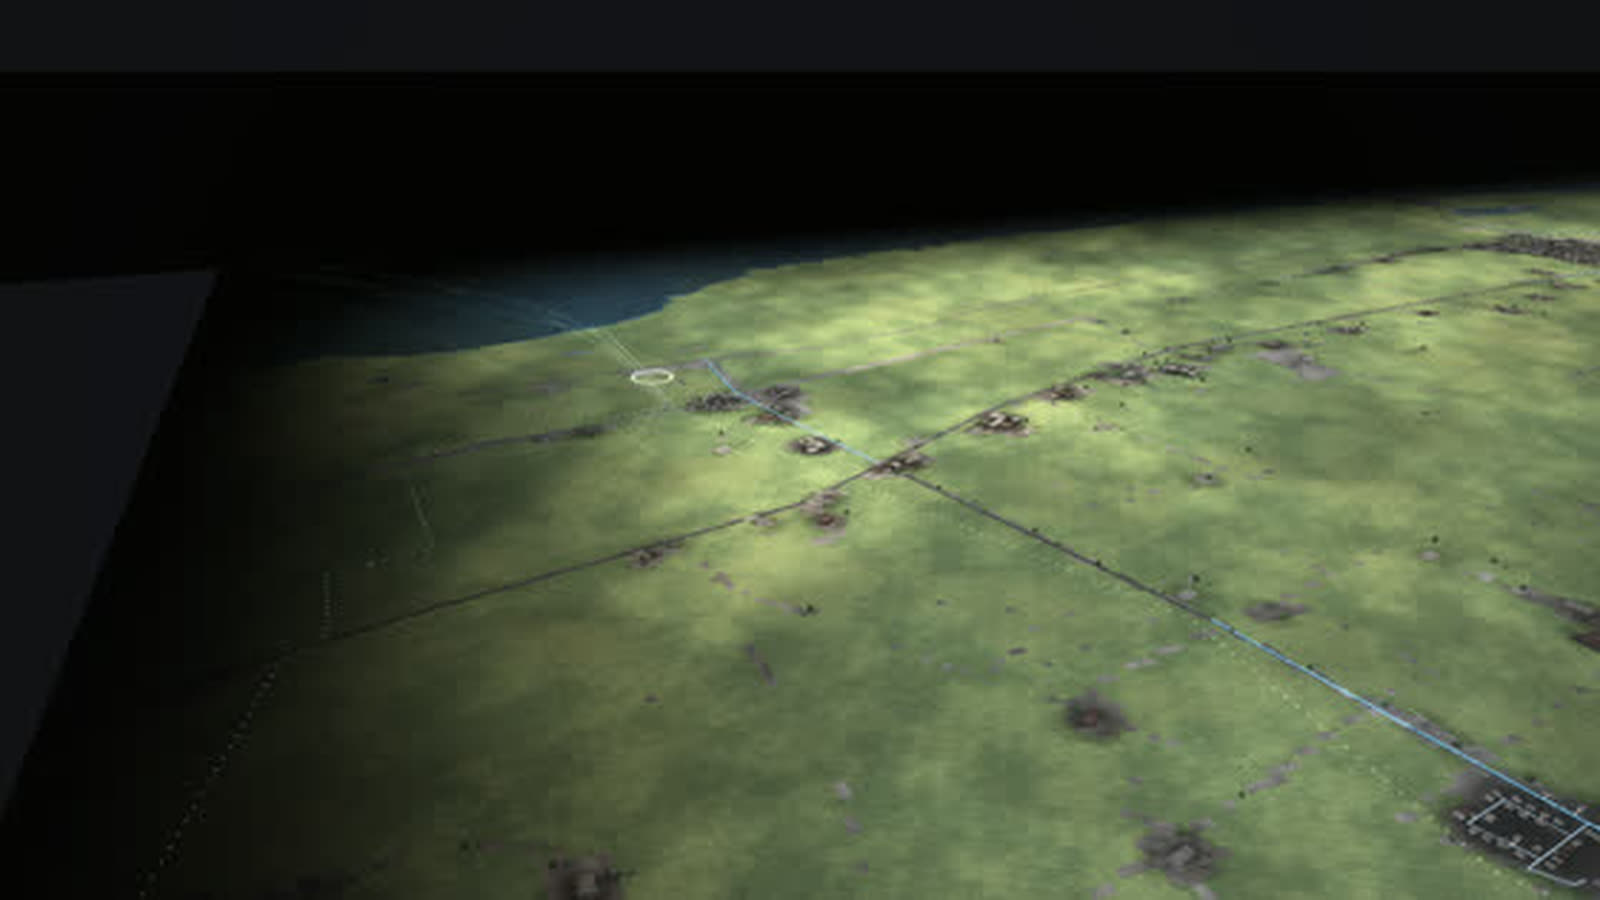
The path of the power: each wind farm collects its power on a substation platform and steps it up from 33 to 155 kV. Two converter platforms turn it into direct current, the first with ±320 kV and 800 MW since July 2015, the second with 900 MW since 2018 – direct current loses less on long submarine cables. Submarine cables carry the power to the coast near Norden and on to the Emsland.
The wind farms show the leap in technology: 5 MW per turbine at alpha ventus and Borkum I, 8.3 MW with a 164 m rotor at Borkum Riffgrund 2, at the time among the largest wind turbines in the world. Supply vessels bring technicians out; in the stormy night the farms deliver more than is needed. For operators and grid connection, coastal municipalities, chambers and associations, universities and exhibitions.
The chain of the place
- 01
The beginning: It began in 2009 with twelve test turbines: alpha ventus, 45 km off Borkum.
- 02
The cluster: By 2020 the cluster had grown to 284 turbines with about 1,660 MW.
- 03
Collecting: Each farm collects its power on a substation platform and steps it up from 33 to 155 kV.
- 04
Direct current: The converter platform turns it into direct current, which loses less on long submarine cables.
- 05
Ashore: Submarine cables carry the power to the coast near Norden and on to the Emsland.
- 06
Maintenance: Supply vessels bring technicians to the turbines.
What is shown – why – for whom
| What is shown | Why | For whom |
|---|---|---|
| Cluster of 284 turbines, each with its year from the register | Whyshows the scale of offshore wind off Borkum | For whomThe public, planning |
| Substation and converter platforms | Whyshow how alternating current is collected and turned into direct current | For whomGrid connection, universities |
| Diagram ‘Additions and closures’ | Whyshows how much capacity is added and removed each year | For whomAssociations, policymakers |
| Diagram ‘Imports and exports’ | Whyshows power across the borders to the neighbours | For whomGrid planning, teaching |
| Diagram ‘Capacity of this place 1975–2025’ | Whyshows the rise in installed capacity per year | For whomEconomic development, exhibitions |
| Diagram ‘Every plant now’ | Whysets installed capacity against what each plant delivers in this hour | For whomOperators, planning |
| Event ‘Stormy night’ | Whyshows surplus, curtailment and storage charging | For whomGrid operations, the public |
Facilities and areas in the model
-
alpha ventus
Germany's first offshore test field: 12 turbines of 5 MW each, six by Areva and six by REpower, in about 30 m of water. First kilowatt hour in August 2009, complete from April 2010.
-
Umspannplattform alpha ventus
AC substation platform 110/30 kV. From here a 110 kV submarine cable runs via Norderney to the Hagermarsch substation, about 60 km.
-
Windpark Borkum I
Built by an alliance of about 30 municipal utilities: 40 turbines of 5 MW each, since 2015.
-
Windpark Borkum II
Second phase 2019/20: 32 turbines of 6.3 MW each with a 152 m rotor.
-
Borkum Riffgrund 1
78 turbines with about 330 MW in total, in operation since 2015 (Ørsted).
-
Borkum Riffgrund 2
56 turbines of 8.3 MW each with a 164 m rotor, built in 2018/19. At the time they were among the largest wind turbines in the world.
-
Merkur Offshore
66 turbines of 6 MW each, about 400 MW, in operation since 2019.
-
DolWin alpha (DolWin1)
Converter platform: it turns the wind farms' alternating current into ±320 kV direct current, 800 MW, since July 2015. Borkum Riffgrund 1 and both Borkum farms are connected.
-
DolWin gamma (DolWin3)
Second converter platform at the same place, 900 MW, since 2018. It links Merkur Offshore and Borkum Riffgrund 2 with the shore.
-
Umspannplattform Borkum
The wind farm's substation platform: steps the power up from the array grid (33 kV) to 155 kV (position OpenStreetMap).
-
Umspannplattform Borkum Riffgrund 1
The wind farm's substation platform: steps the power up from the array grid (33 kV) to 155 kV (position OpenStreetMap).
-
Umspannplattform Borkum Riffgrund 2
The wind farm's substation platform: steps the power up from the array grid (33 kV) to 155 kV (position OpenStreetMap).
-
Umspannplattform Merkur
The wind farm's substation platform: steps the power up from the array grid (33 kV) to 155 kV (position OpenStreetMap).
Processes in the model
The chain of the place
- 01The beginning: It began in 2009 with twelve test turbines: alpha ventus, 45 km off Borkum.
- 02The cluster: By 2020 the cluster had grown to 284 turbines with about 1,660 MW.
- 03Collecting: Each farm collects its power on a substation platform and steps it up from 33 to 155 kV.
- 04Direct current: The converter platform turns it into direct current, which loses less on long submarine cables.
- 05Ashore: Submarine cables carry the power to the coast near Norden and on to the Emsland.
- 06Maintenance: Supply vessels bring technicians to the turbines.
One day
- 01“Play the day”
- 02the sun moves, wind and demand change every hour
- 03the stacks above the plants grow and shrink
- 04storage charges and discharges
Fifty years
- 01▶ at the year (time travel)
- 022009
- 032015
- 042019
- 052025
- 06plants appear, run, are shut down and dismantled; the history of the place jumps to every year
How offshore wind can use the model
-
Operations and grid connection
Wind farms, substation platforms, converters and cable routes in one picture: the model shows which farms are connected to which converter platform and how the power goes from 33 kV via 155 kV to direct current.
For whomOperators, grid connection, offshore planning
-
Coast and region
What is built out at sea arrives at the coast: submarine cables come ashore near Norden and continue to the Emsland. The picture links sea and inland for talks about landfall and expansion.
For whomCoastal municipalities, economic development, chambers
-
Schools and universities
Why is offshore power transmitted as direct current? The six steps from the beginning in 2009 via cluster, collecting and direct current to the shore and maintenance fly to each part.
For whomTeachers, electrical and marine engineering students
-
Museums and exhibitions
Time travel shows 2009, 2015, 2019 and 2025: first twelve test turbines, then Borkum I and Borkum Riffgrund 1, then Borkum II, Borkum Riffgrund 2 and Merkur. The diagram ‘Additions and closures’ shows the additions per year.
For whomMuseums, exhibitions, visitor centres
-
Public communication
What happens when a storm comes? In the stormy night the farms deliver more than is needed: power flows south and abroad, yellow rings show curtailment, storage charges.
For whomPublic relations, associations, policymakers
What you can change
Controls
- Year 1975–2025: plants appear and disappear, mix and grid change; ▶ lets the years run.
- Season: snow, foliage, meadows, chimney smoke; more heat and power demand in winter, more sun in summer.
- Time of day: sun position, dusk, night with windows and street lights; demand follows the daily profile.
- Wind: rotors turn faster, sea state, smoke plumes lie flat; wind power rises, curtailment in a storm.
- Sun: clouds and soft shadows; photovoltaics deliver more or less.
- Demand (households, industry): more lit windows, plant lighting, chimney smoke; more expensive plants step in.
- Views: power, heat, fuels, storage, CO₂ – each with its own columns, stacks and values.
Events
- Stormy night: Winter gale at 3 am with low demand. Wind delivers more than is needed. Look for: blue cubes above the frame, power flows south and abroad, yellow rings show curtailment, storage charges.
- Winter evening without wind or sun (tiles): Season winter, evening, calm, overcast: demand peaks, the stacks above wind and solar shrink, fossil plants, storage and imports carry the load.
- Stormy night (tiles): Night, gale, low demand: wind delivers more than is needed, storage charges, surplus is curtailed or exported.
What the model gives offshore wind
-
01
The sea as a place
Open sea with waves, wind farms, platforms and supply vessels in 3D, from high above to close to the turbines. The wind control raises rotors and sea state together.
-
02
From test field to cluster
Time travel shows the path from twelve test turbines in 2009 to 284 turbines. The history of the place jumps to every year.
-
03
Power now above the farm
Above Merkur Offshore stands a stack of cubes, one cube 20 MW, the frame the installed capacity. In calm weather it shrinks, in the stormy night it grows.
-
04
The way ashore belongs to it
The place ‘Coast near Norden’ shows where the submarine cables come ashore under the dike – both places are part of the same model.
-
05
In the browser and on the big screen
A browser is enough, and large projections work too. Eleven more places and the map of Germany are part of the same model, designed by an artist and developer.
Your offshore wind farm as a model
Would you like to show your wind farm, your platform or your grid connection this way, with real yields and availability? Write to us or give us a call, and we will discuss which data the model needs. We will send you the password to the simulation on request.
cube4tec.de/spiele/minimal-energy/
Ask about this
Minimal Energy: Nordsee vor Borkum
Basis and limits
Real are every turbine with its year from the market master data register, platforms and cable routes (OpenStreetMap) and the capacities as stated by the grid operator. The sea has no elevation data, ship traffic is schematic; what the wind farms deliver now comes from the model.
Public sources the model is based on:
- OpenStreetMap-Mitwirkende (ODbL)
- Marktstammdatenregister der Bundesnetzagentur (dl-de/by-2-0)
- Wikipedia: Liste der deutschen Offshore-Windparks (sekundaer)
More places in the model
-
Coast near Norden
Where energy from the North Sea comes ashore, as a walkable model: six direct-current cables under the dike, natural gas from Norway since 1995 and more than 200 wind turbines behind the dike.
-
Paderborn plateau
One of the densest wind landscapes in North Rhine-Westphalia as a walkable model: every turbine with its year, from the 500 kW turbine of 1995 to the 6.2 MW turbine with a 169 m hub.
-
Lingen
The whole nuclear era in one place as a walkable model: the Lingen nuclear plant of 1968, the Emsland nuclear plant until April 2023, interim storage and dismantling – next to them gas, a battery and hydrogen.
-
Wilhelmshaven
Germany’s only deep-water port as a walkable model: crude oil for the pipeline to the Rhineland, coal for two power plants and, since December 2022, liquefied natural gas from Germany’s first LNG terminal.
-
Germany 1975–2025
Fifty years of energy supply on one map: 365 sites, ten grid regions and the power of every hour – from two separate grids in 1975 to wind and sun in 2025.
-
Rhineland lignite district
The Rhineland lignite district as a walkable model: from the Garzweiler mine via conveyors, boilers and cooling towers into the 380 kV grid – while wind, sun and batteries grow on the reclaimed land.
-
Düsseldorf Lausward
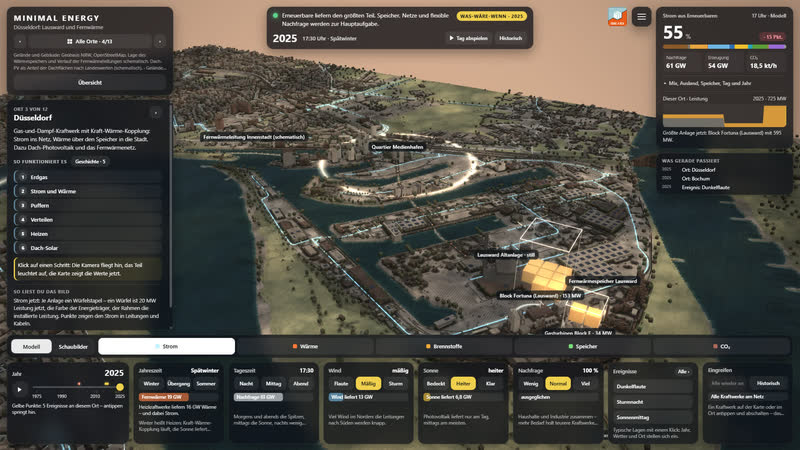
A combined-cycle gas plant on the Rhine as a walkable model: power to the grid, heat via a 58 m storage tank and the district heating line into the media harbour and the city centre.
-
Herdecke
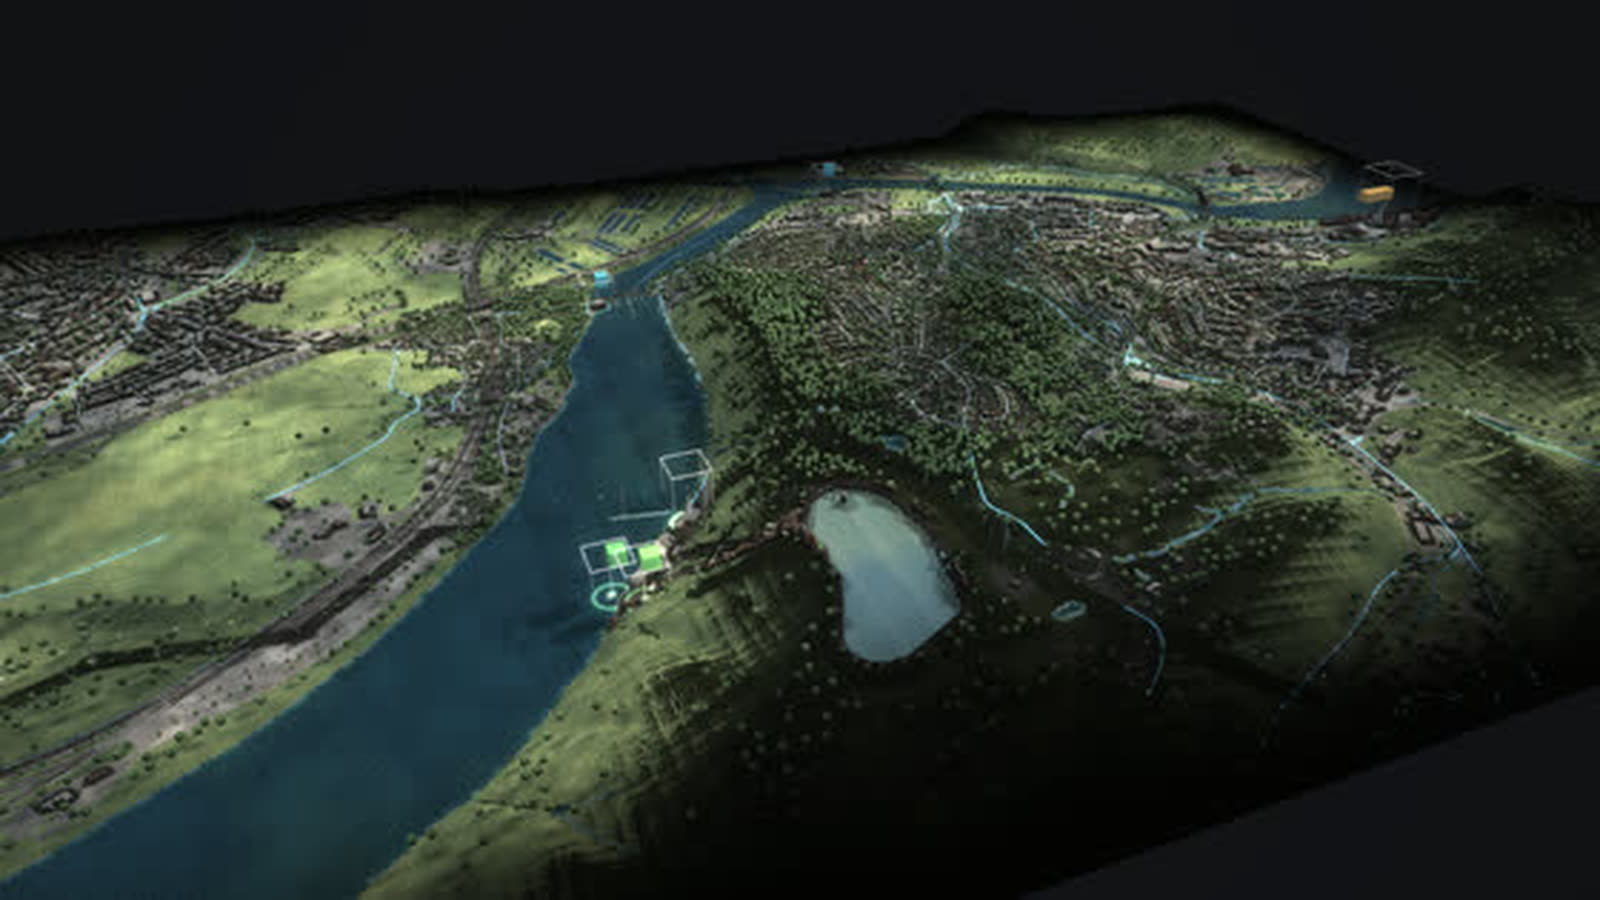
Three generations of storage at Lake Hengstey as a walkable model: the Koepchenwerk of 1930, the pumped-storage plant of 1989 and batteries since 2017 – the level in the reservoir follows sun, wind and demand.
Real are every turbine with its year from the market master data register, platforms and cable routes (OpenStreetMap) and the capacities as stated by the grid operator. The sea has no elevation data, ship traffic is schematic; what the wind farms deliver now comes from the model. With your data it…