
Simulation · Minimal Logistik · Seaports
Wilhelmshaven · JadeWeserPort and LNG terminal
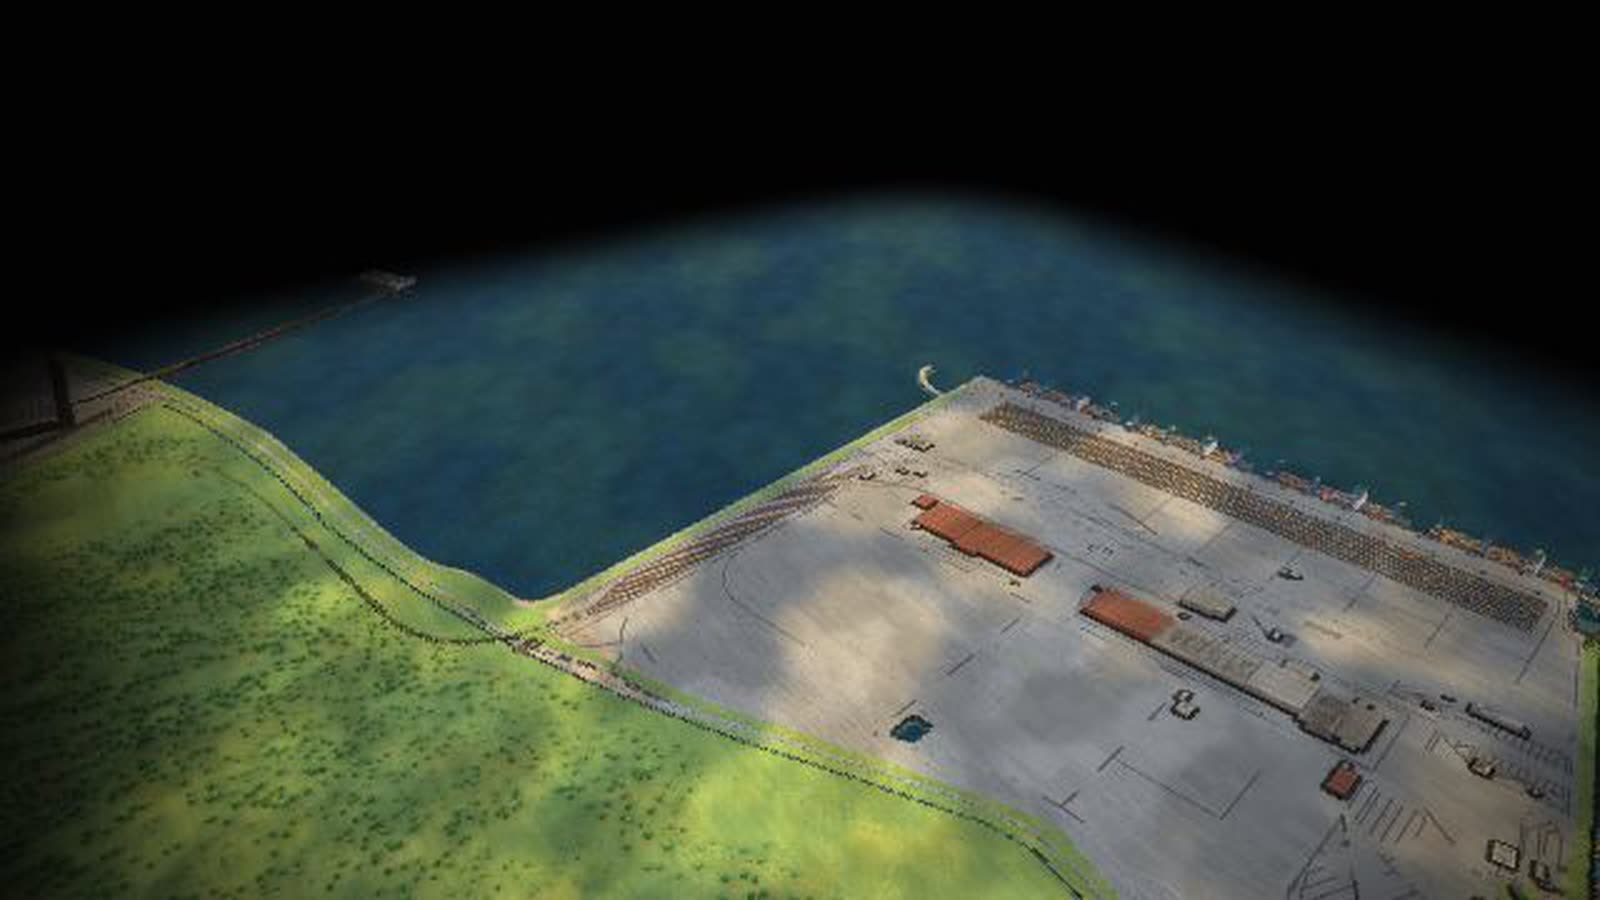
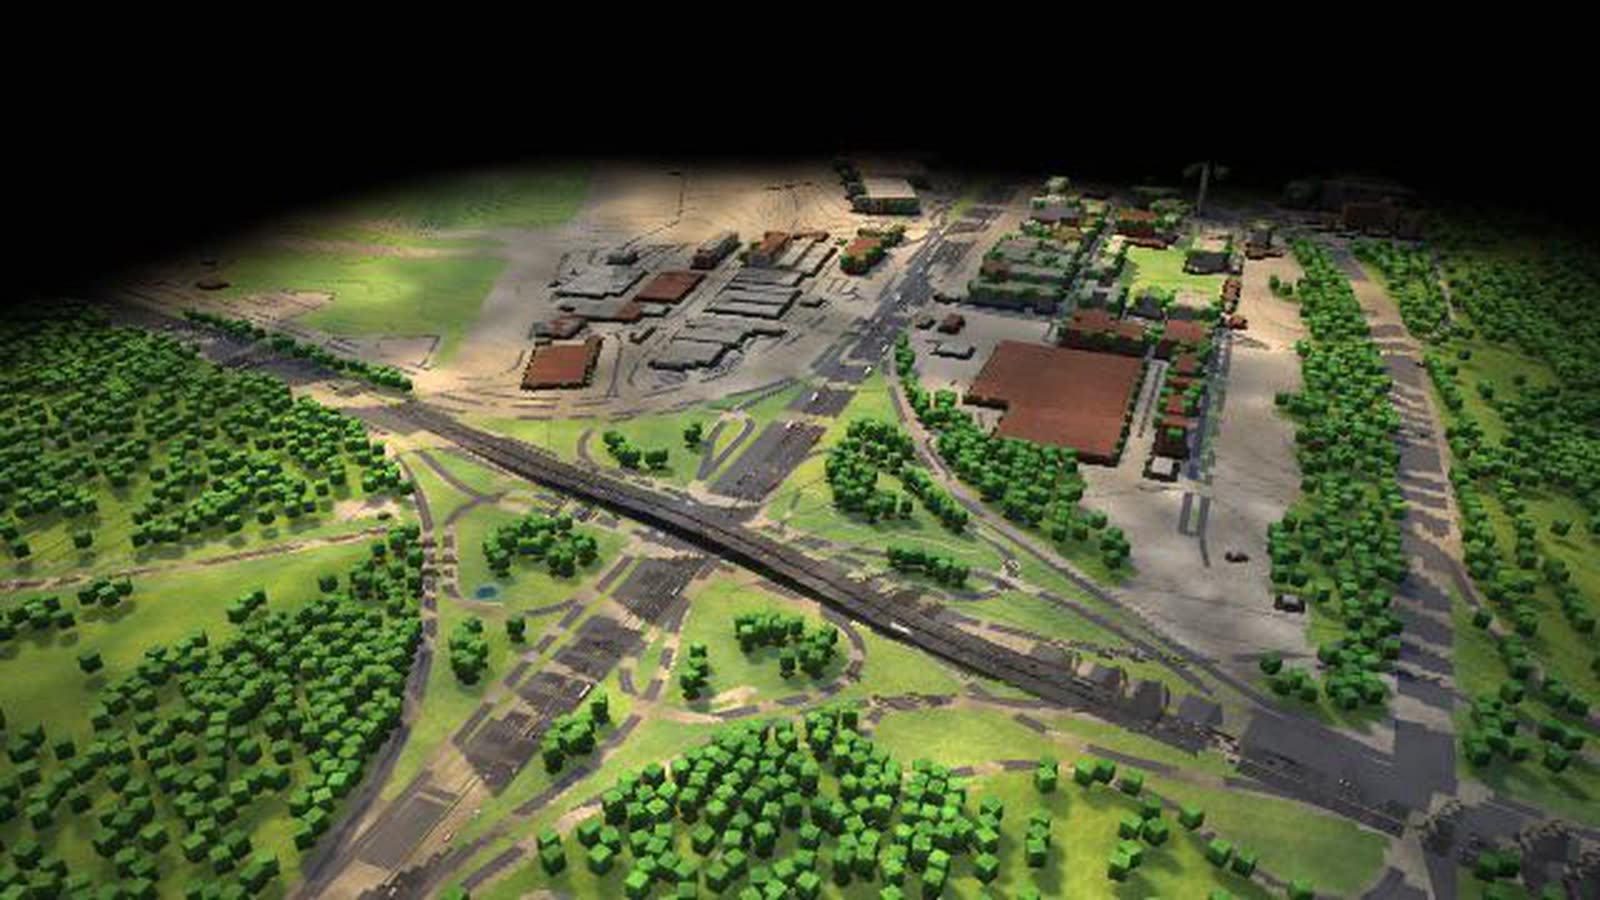
Germany’s only deep-water port as a walkable model: the container quay on the Jade with straddle carriers and rail, plus the floating LNG terminal, a tank farm and the crude-oil pipeline to the refineries.
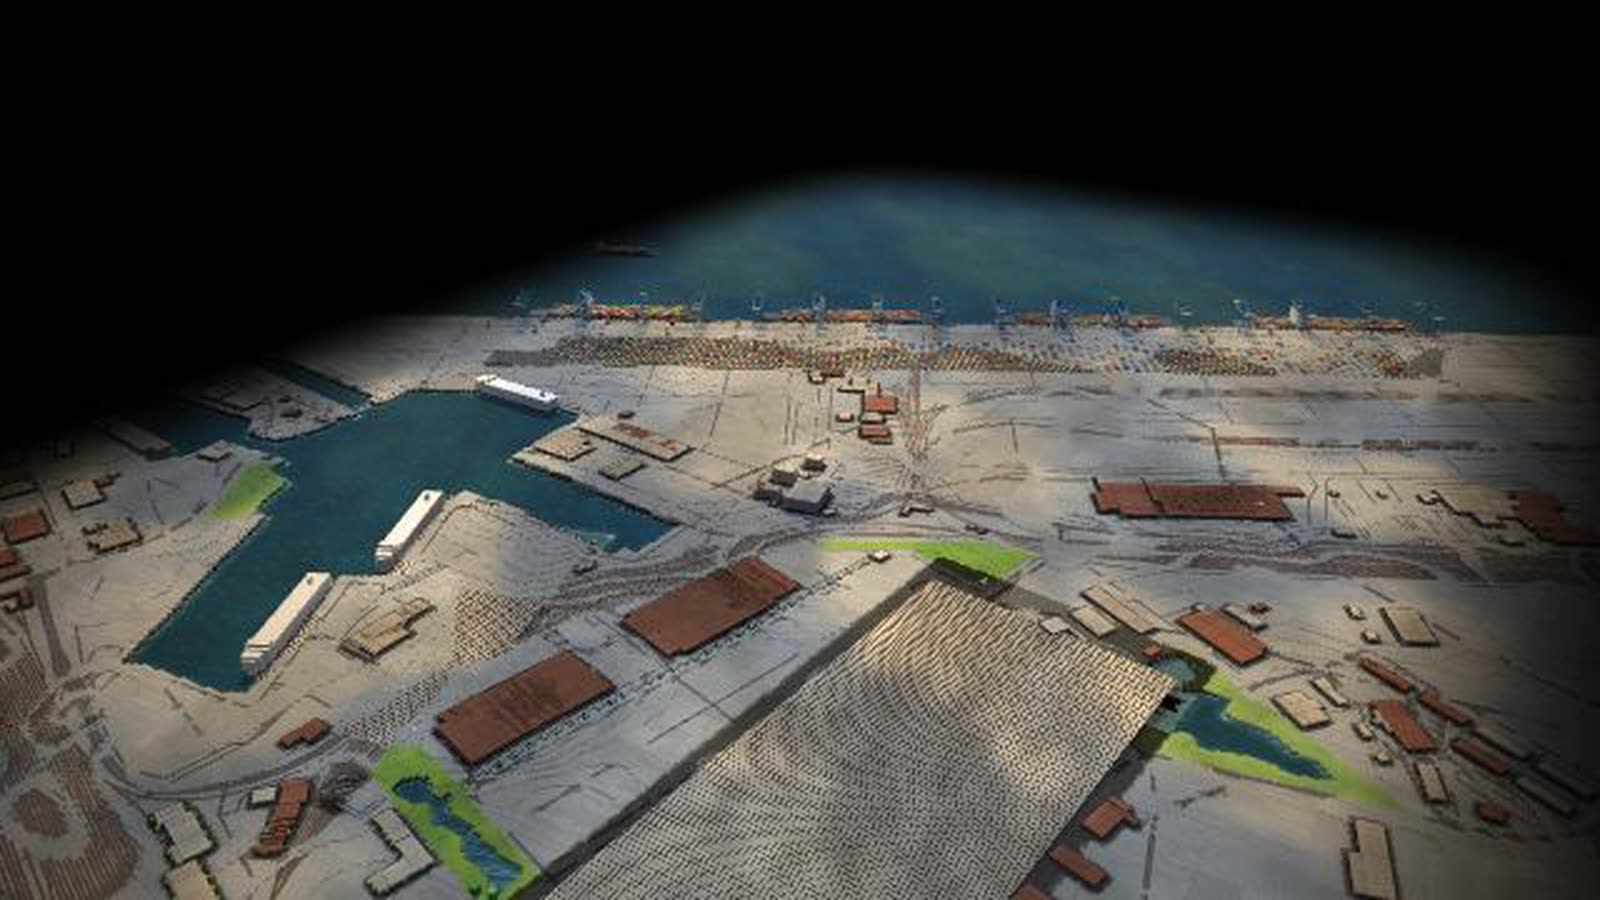
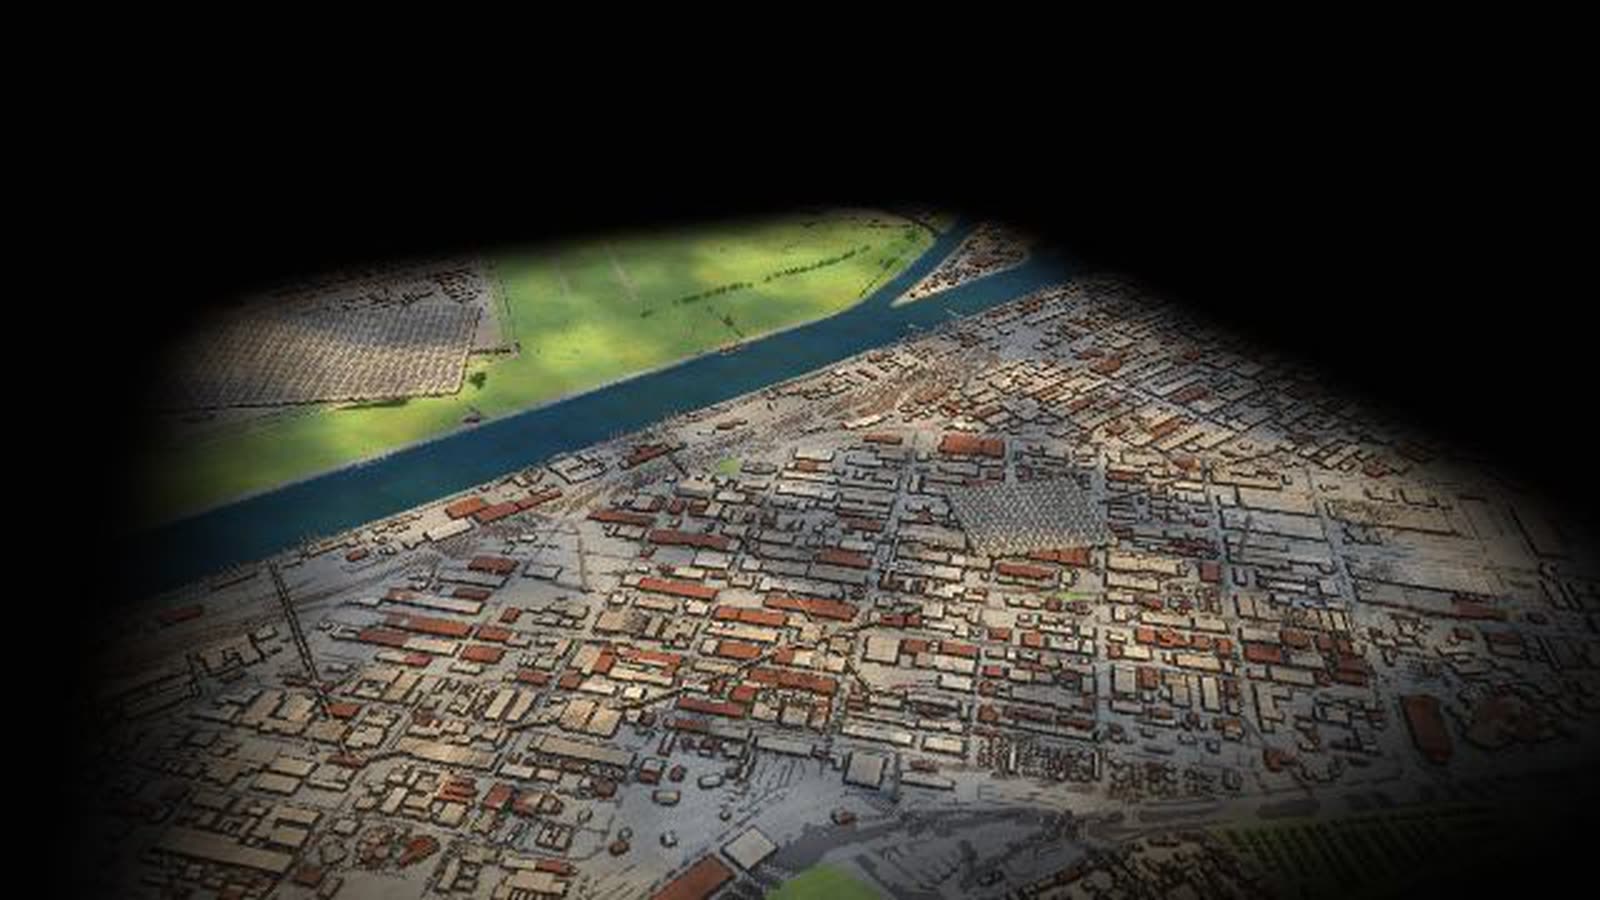
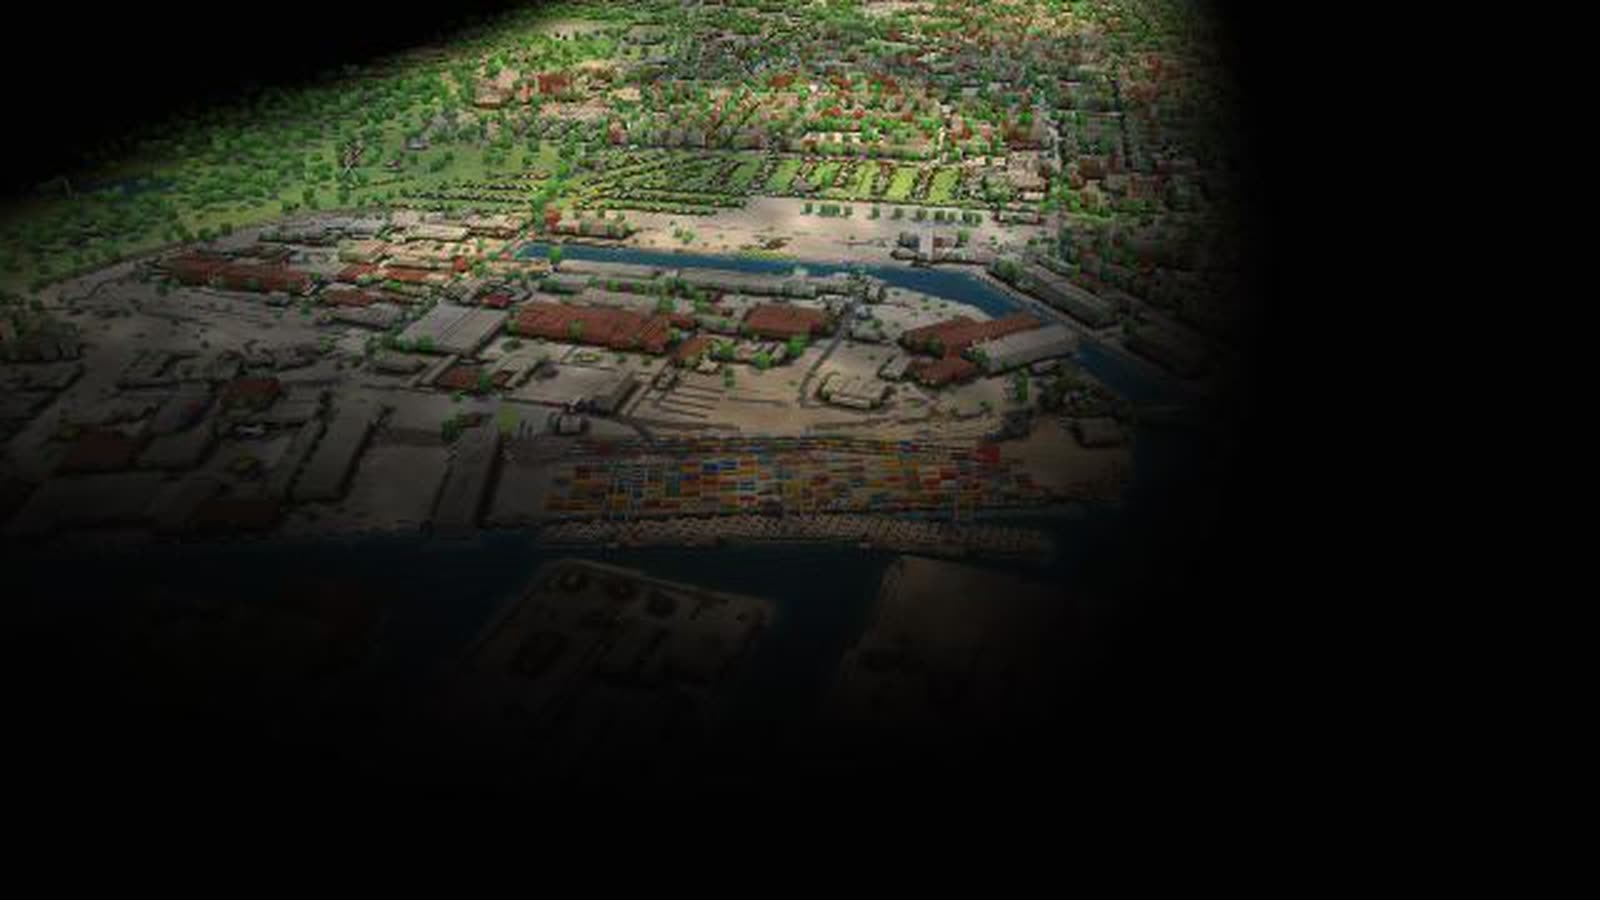
Real are the location, terrain and buildings (open elevation data, OpenStreetMap) and the site profile figures. Volumes, rhythms and vehicle numbers are model assumptions; the tanker sequence is schematic. With your data, the model also shows tanker arrivals, tank farm levels and trains per day.
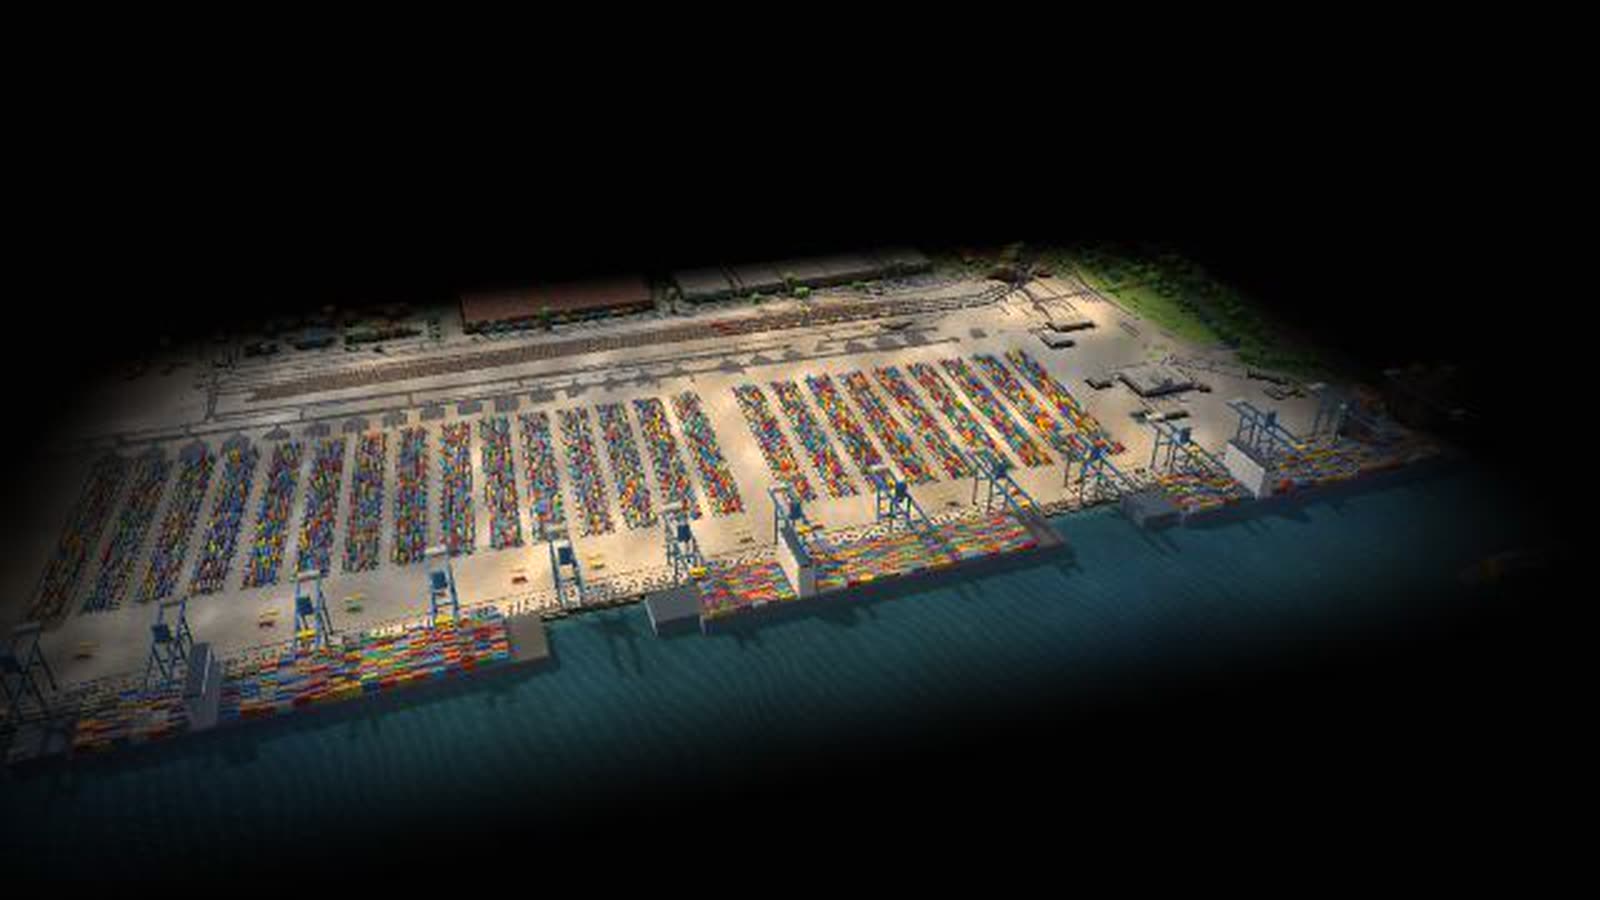
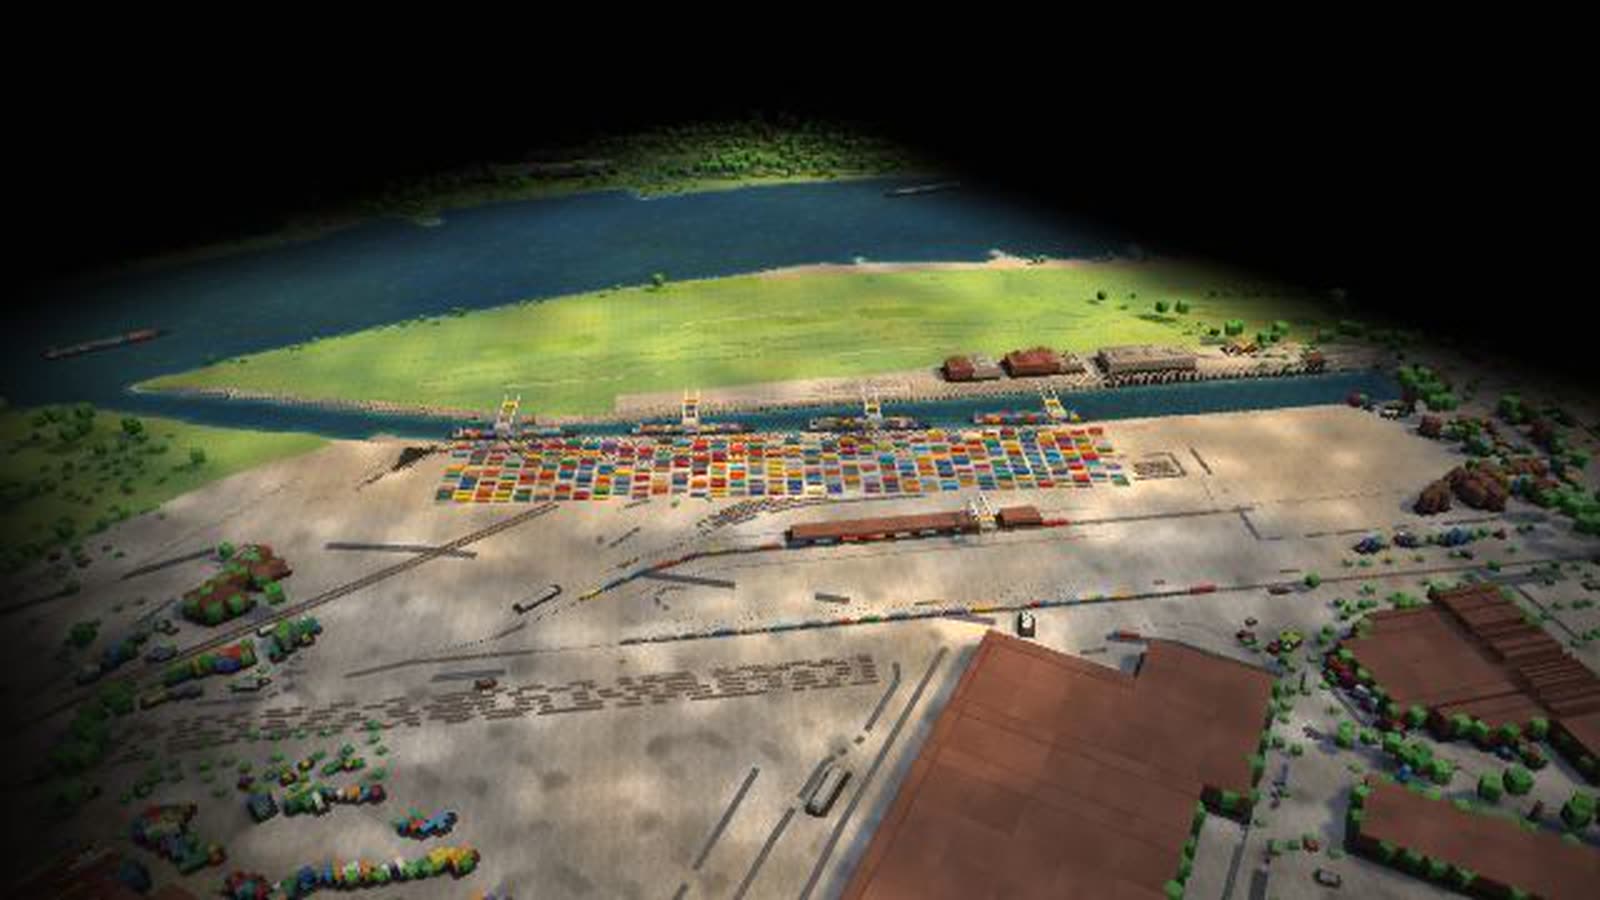
The Wilhelmshaven deep-water port as a running model: at the 1.7-km quay on the Jade fairway, even the largest container ships arrive regardless of the tide. Straddle carriers move the boxes between gantry, stacks and railway, and container trains head for Bremen, Hanover and the Ruhr.
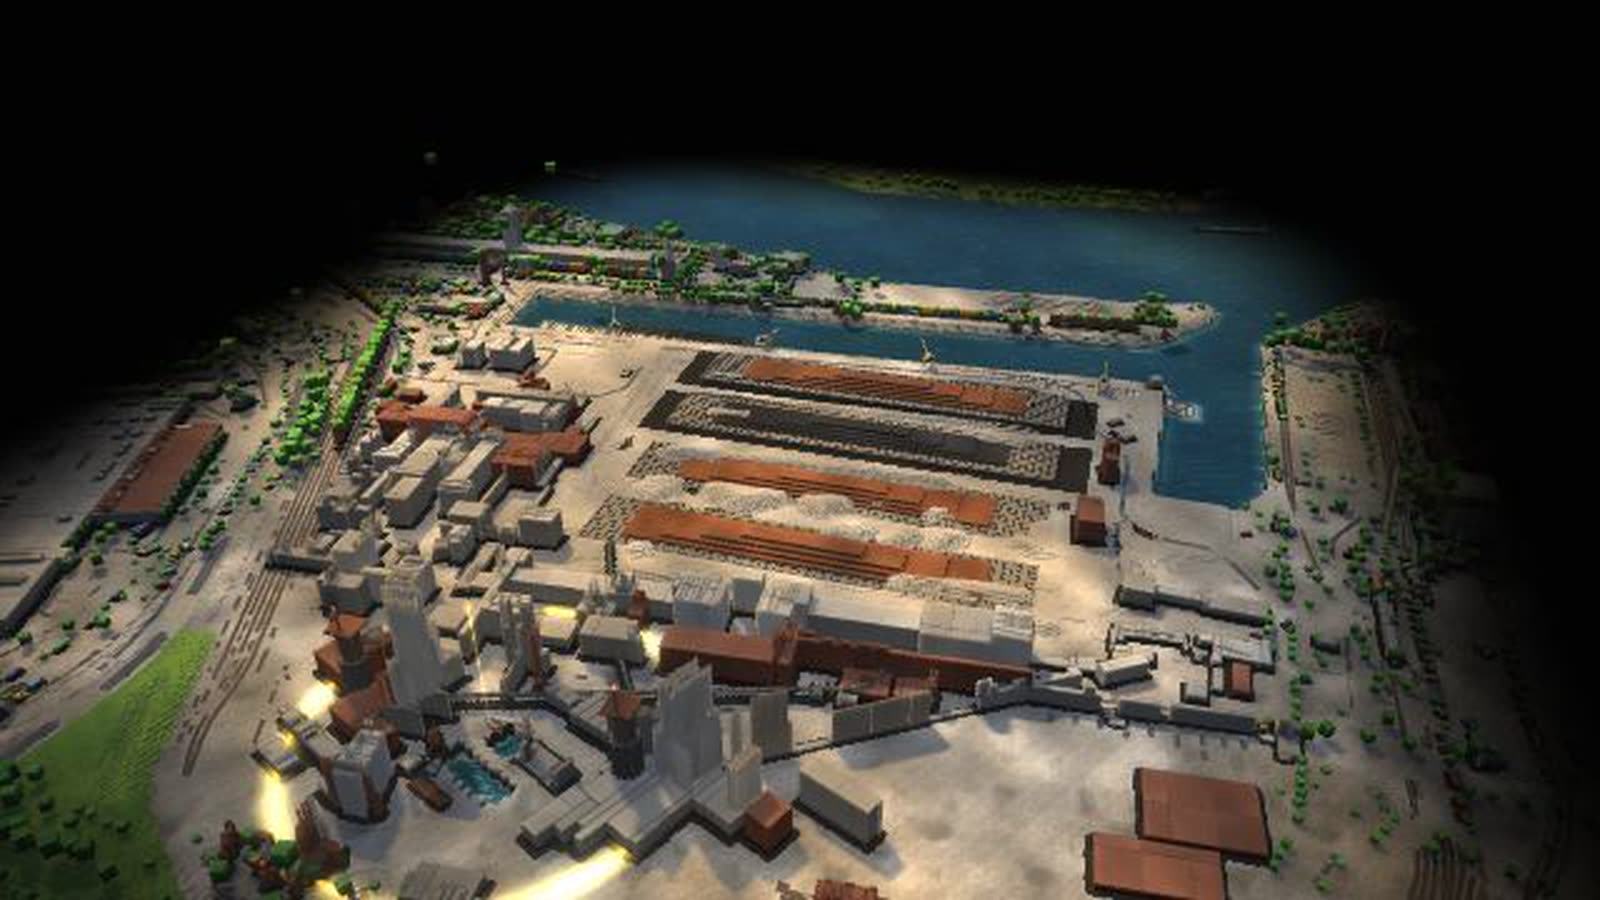
To the north lies the floating LNG terminal at the Voslapper Groden jetty: gas carriers discharge their LNG, it is turned back into gas on board and fed into the transmission grid. There is also a tank farm for oil and oil products and a crude-oil pipeline to the refineries. In the model, 95 % of the node’s volume is energy carriers in the pipeline and only 5 % containers on rail. A port strike, storm and fog hit this site hardest and show how vulnerable energy and container flows are.
Real are the location, terrain and buildings, taken from open elevation data and OpenStreetMap, and the figures in the site profile, taken from public information: about 843,000 TEU in 2024, over one million for the first time in 2025. Daily volumes, rhythms and vehicle numbers are model assumptions, the sequence of tankers is schematic, and processes run accelerated. This page is for the port and energy industries, planning, local authorities and economic development, chambers, schools and exhibitions.
A ship in port (riding along, key F)
- 01
waiting at anchor
- 02
coming in
- 03
at the quay: being unloaded and loaded
- 04
leaving
What is shown – why – for whom
| What is shown | Why | For whom |
|---|---|---|
| Container quay: about 1.7 km on the deep Jade channel | WhyShows why the largest ships arrive regardless of the tide. | For whomPort planning, teaching |
| Container yard with straddle carriers, fill level = node stock | WhyShows the route between gantry, yard and rail. | For whomTerminal operations, onboarding |
| Floating LNG terminal at the Voslapper Groden jetty | WhyExplains how LNG becomes gas again on board. | For whomEnergy industry, schools |
| Tank farm and crude-oil pipeline to the refineries | WhyShows energy flows that are otherwise invisible. | For whomEnergy industry, local authorities |
| Container trains towards Bremen, Hanover and the Ruhr | WhyShows the link to the hinterland. | For whomRail logistics, economic development |
| Disruptions: port strike, storm and fog | WhyShow how vulnerable energy and container flows are. | For whomPublic relations, associations |
Facilities and areas in the model
-
JadeWeserPort container quay
About 1.7 km of quay right on the deep Jade channel: even the largest container ships come in regardless of the tide. About 843,000 TEU in 2024, over one million for the first time in 2025.
-
Container yard
Straddle carriers move boxes between gantry, yard and rail. Fill level follows the node’s stock (model).
-
LNG terminal
Floating terminal at the Voslapper Groden jetty: gas carriers discharge their LNG, it is regasified on board and fed into the transmission grid. Sequence of carriers schematic.
-
Tank farm
Storage for oil and oil products at the northern edge. Fill level follows the node’s stock (model).
-
Terminal railway
Container trains to the hinterland – towards Bremen, Hanover and the Ruhr.
Processes in the model
A ship in port (riding along, key F)
- 01waiting at anchor
- 02coming in
- 03at the quay: being unloaded and loaded
- 04leaving
A train in the terminal (riding along, key F)
- 01arriving
- 02being loaded
- 03departing
A truck at the gate (riding along, key F)
- 01driving to the gate
- 02check-in at the gate
- 03driving to the loading point
- 04being loaded
- 05leaving
Try the scenario ‘Port strike’
- 01tap it in the deck
- 02vehicles, yards and traffic-light rings at the site react at once
- 03time 4× shows how it develops
- 04‘Back to today’
How a deep-water port can use the model
-
Operations and planning
Containers, LNG, oil and crude oil sit side by side in one model. Economy and industry change quay, container yard and tank farm at once; their fill levels follow the node’s stock.
For whomPort operations, planning, energy industry
-
Onboarding and training
Ride along with key F: a ship from the anchorage to the quay, a container train through the terminal station, a truck from the gate to the loading point. One line says what is happening.
For whomNew staff, port trainees
-
Local authorities and economic development
Container trains to Bremen, Hanover and the Ruhr, natural gas through the transmission grid as far as the Ruhr, crude oil to the refineries: the model shows what the site carries for its hinterland.
For whomCity, economic development, chambers
-
Schools, universities, museums
How does liquefied gas get from the tanker into the gas grid? Why is Wilhelmshaven independent of the tide? The model explains both on the site, also as a demo without anyone at the controls.
For whomSchools, universities, museums and exhibitions
-
Public communication
The ‘Port strike’ scenario shows at four times the speed how handling stops and ships wait at anchor. In storm and fog the cranes stand still.
For whomPublic relations, port and energy industries
What you can change
Controls
- Economy: How much is produced and traded overall. Acts on all flows of Wilhelmshaven.
- Consumer demand: Container goods and food for retail. Weight here about 41 % of the volume.
- Industrial output: Raw materials, steel, parts, chemicals. Weight here about 59 % of the volume.
- Transport cost / tolls: Expensive roads shift freight to rail and water. Here 0 % of the volume goes by road.
- Season: Spring: more building materials and seed, raw materials +8 %, food +5 %. Autumn: harvest (food +18 %), Christmas run-up (containers +8 %), first heating oil deliveries. Winter: heating oil and Christmas trade, less road capacity.
Disruptions
- Disruption: Port strike (hits this site hardest): Hardly any handling, ships wait at anchor, containers pile up.
- Extreme weather: Storm, fog (hits this site hardest): Cranes in the seaports stop, ships wait, motorways slower.
- Extreme weather: Snow and ice: Bottlenecks overloaded, canals partly frozen.
What the model gives a deep-water port
-
01
Energy and containers together
LNG, oil and containers share one site. In the model, 95 % of the node’s volume is energy carriers – hardly visible in a picture of the port.
-
02
Tide independence explained
The quay right on the deep fairway shows why Wilhelmshaven is Germany’s only deep-water port.
-
03
Disruptions without damage
Trigger a port strike, storm, fog or ice, see what stops, then return to today.
-
04
Site and map in one model
Fill levels in the container yard and the tank farm follow the node’s stock on the Germany map.
-
05
For visits and big screens
Runs in the browser and on large projections; the site profile shows every part with live values.
Your port as a model
Would you like to see your quay, terminal or energy flows like this? Contact us by email or phone and we'll discuss which ship, tanker and stock data the model needs. The password is available on request.
cube4tec.de/spiele/minimal-logistik/
Ask about this
Minimal Logistik: Wilhelmshaven · JadeWeserPort und LNG-Terminal
Basis and limits
Real are the location, terrain and buildings of Wilhelmshaven (open elevation data and OpenStreetMap) and the figures in the site profile, taken from public information. Daily volumes, rhythms and vehicle numbers are model assumptions in the right order of magnitude; processes run accelerated.
Public sources the model is based on:
- OpenStreetMap contributors: map data (ODbL 1.0)
- OpenFreeMap / OpenMapTiles: vector tiles
- Terrain Tiles, AWS Open Data (Terrarium)
- Trade press: how the port of Wilhelmshaven is changing (2024)
- Trade press: JadeWeserPort above one million TEU for the first time in 2025
- Trade press: LNG terminal – special vessel reaches Wilhelmshaven
- Federal Statistical Office: freight transport by mode
- German Environment Agency: freight emission data 2024 (g CO₂e per tonne-kilometre)
More places in the model
-
Hamburg · Container Terminal Altenwerder
An automated container terminal as a walkable model: up to 14 container gantries, driverless transport vehicles, the block yard, a rail station for trains up to 740 m and the truck gate.
-
Bremerhaven · car terminal and river quay
Bremerhaven as a walkable model: almost five kilometres of river quay for the largest container ships, straddle carriers, car trains and parking for about 95,000 vehicles at the mouth of the Weser.
-
Ludwigshafen · chemicals on the Rhine
A large chemical site on the Upper Rhine as a walkable model: tankers at loading arms, tank wagons on the works railway, pipe bridges, the Friesenheimer Insel tank farm and the container quay.
-
Germany · freight flows and nodes
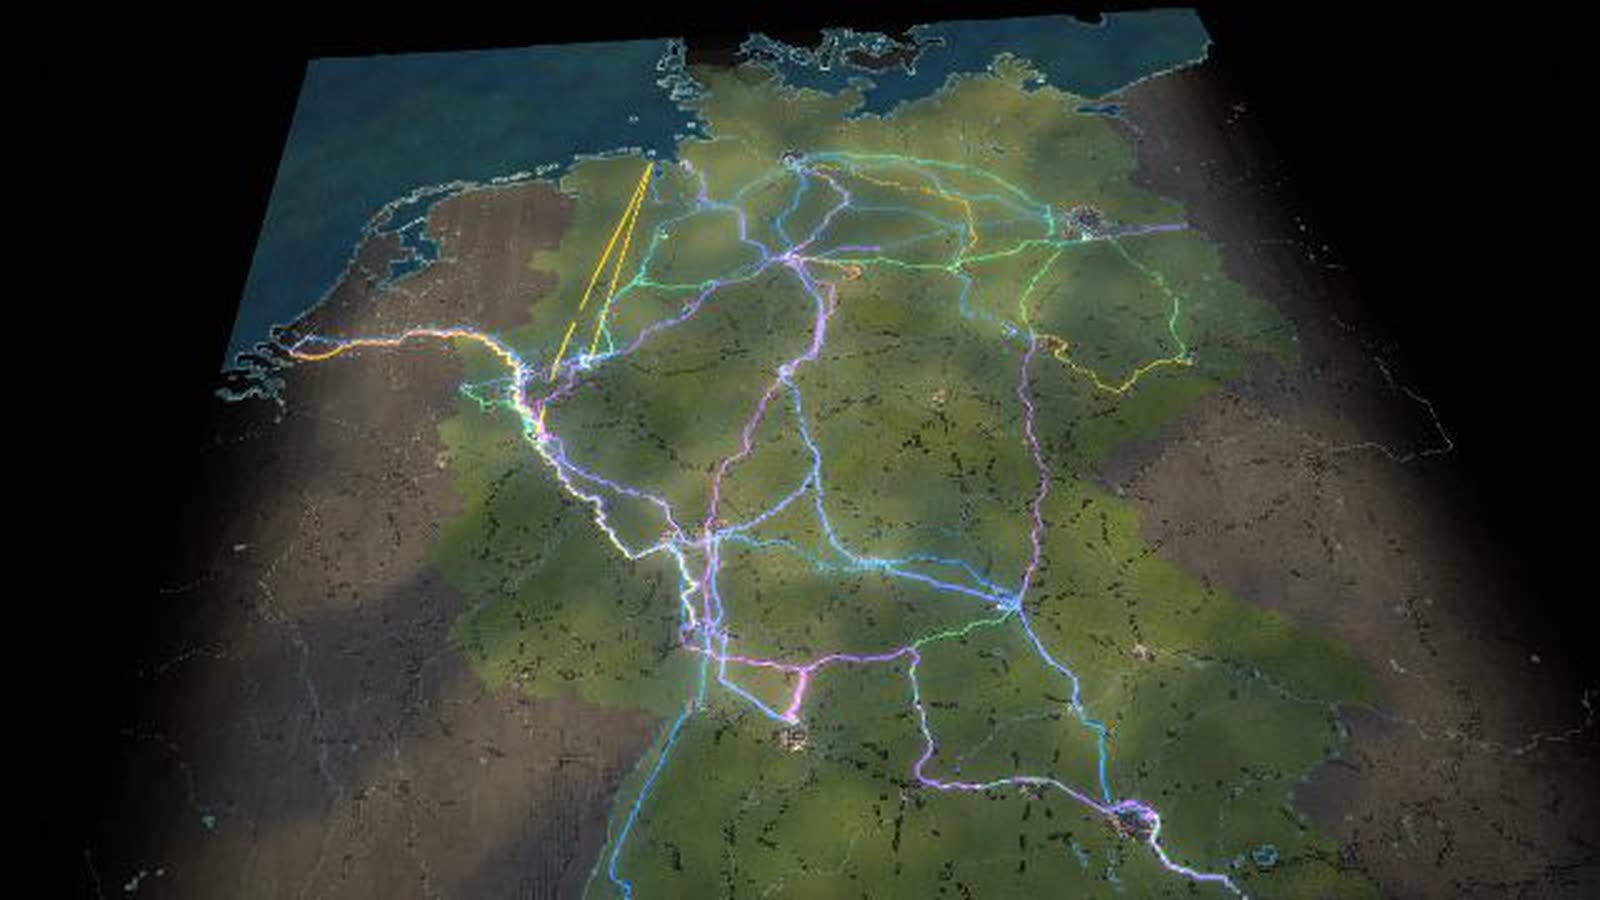
All of Germany as a map of blocks: 27 nodes, 55 freight flows as bands of light, eleven bottlenecks with traffic lights. Controls, seasons, disruptions and ten scenarios change every flow at once, compared with today.
-
Duisburg · logport I (Rheinhausen)
A trimodal inland port on the Rhine as a walkable model: Rhine barges with sea containers from Rotterdam, gantries and yard, trains to the south, Eastern Europe and Asia, trucks into the region.
-
Duisburg-Schwelgern · works harbour and blast furnaces
A raw-material chain as a walkable model: push convoys with ore and coal from Rotterdam, grab unloaders, ore and coal stockyards, conveyor belts and the Schwelgern 1 and 2 blast furnaces.
-
Dortmund · canal port and Westfalenhütte
The canal port at the end of the Dortmund-Ems Canal as a walkable model: canal barges with two tiers of containers, three container gantries, four tracks and the route to the Westfalenhütte plant.
-
Frankfurt interchange (A3/A5)
One of Europe’s busiest motorway interchanges as a walkable model: the A3 and A5 cross, the weaving section becomes the bottleneck, and the tailback grows with freight, holidays or snow.
Real are the location, terrain and buildings (open elevation data, OpenStreetMap) and the site profile figures. Volumes, rhythms and vehicle numbers are model assumptions; the tanker sequence is schematic. With your data, the model also shows tanker arrivals, tank farm levels and trains per day.